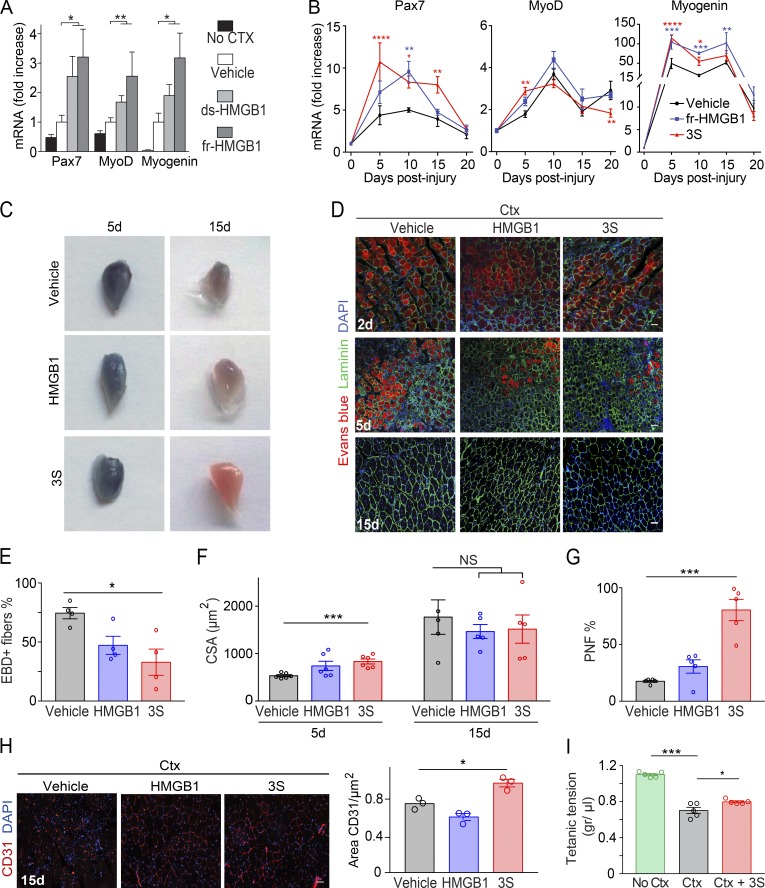
Figure 1.
Intramuscular injection of fr-HMGB1 or 3S accelerates muscle regeneration. (A) Muscle acute injury was induced by injection of Ctx in triceps muscles. Vehicle (PBS) or HMGB1 (fr-HMGB1 or ds-HMGB1) was injected at the same time as Ctx. Quantitative PCR of Pax7, MyoD, and Myogenin (Myog) mRNA in triceps was performed at day 5 after injury (fold increase vs. vehicle). The significance of the difference in gene expression between mice treated with HMGB1 (fr-HMGB1 or ds-HMGB1) and vehicle-treated mice was assessed with Mann-Whitney tests. *, P < 0.05; **, P < 0.01. n = 9 mice per group, three independent experiments. (B–I) Ctx was injected together with vehicle (PBS) or WT fr-HMGB1 (HMGB1) or 3S in TA and/or triceps muscles. Muscle regeneration was assessed at days 2, 5, 10, 15, and 20 after injury. (B) Quantitative PCR of Pax7, MyoD, and Myog mRNA in triceps at days 5, 10, 15, and 20 after injury (fold increase vs. uninjured muscles). n ≥ 5 mice per group, at least two independent experiments. (C) TA muscles, stained with EBD, at days 5 and 15 after injury. (D) EBD, laminin, and DAPI staining of TA muscle sections at days 2, 5, and 15 after injury. Bars, 50 µm. (E) Percentage of EBD-positive myofibers in regenerating TA muscles at day 5 after injury. n = 4 mice per group, two independent experiments. (F) CSA of fibers in TA muscles at days 5 and 15 after injury. n ≥ 5 mice per group, at least two independent experiments. (G) Quantification of myofibers with nuclei at the periphery (PNF) in TA muscles at day 15 after injury. n = 5 mice per group, two independent experiments. (H) CD31 and DAPI staining on TA muscle sections at day 15 after injury and relative quantification of CD31+ area. n = 3 mice per group of three independent experiments. Bars, 50 µm. (I) Tetanic force of TA muscles: uninjured (No Ctx), cardiotoxin-injured (Ctx), Ctx-injured treated with 3S (Ctx + 3S), at day 10 after injury. n = 5 mice per group, two independent experiments. Differences between groups in B and E–I were assessed with one-way ANOVA plus Dunnett’s post-test; data are means ± SEM. *, P < 0.05; **, P < 0.01; ***, P < 0.001; ****, P < 0.0001.

