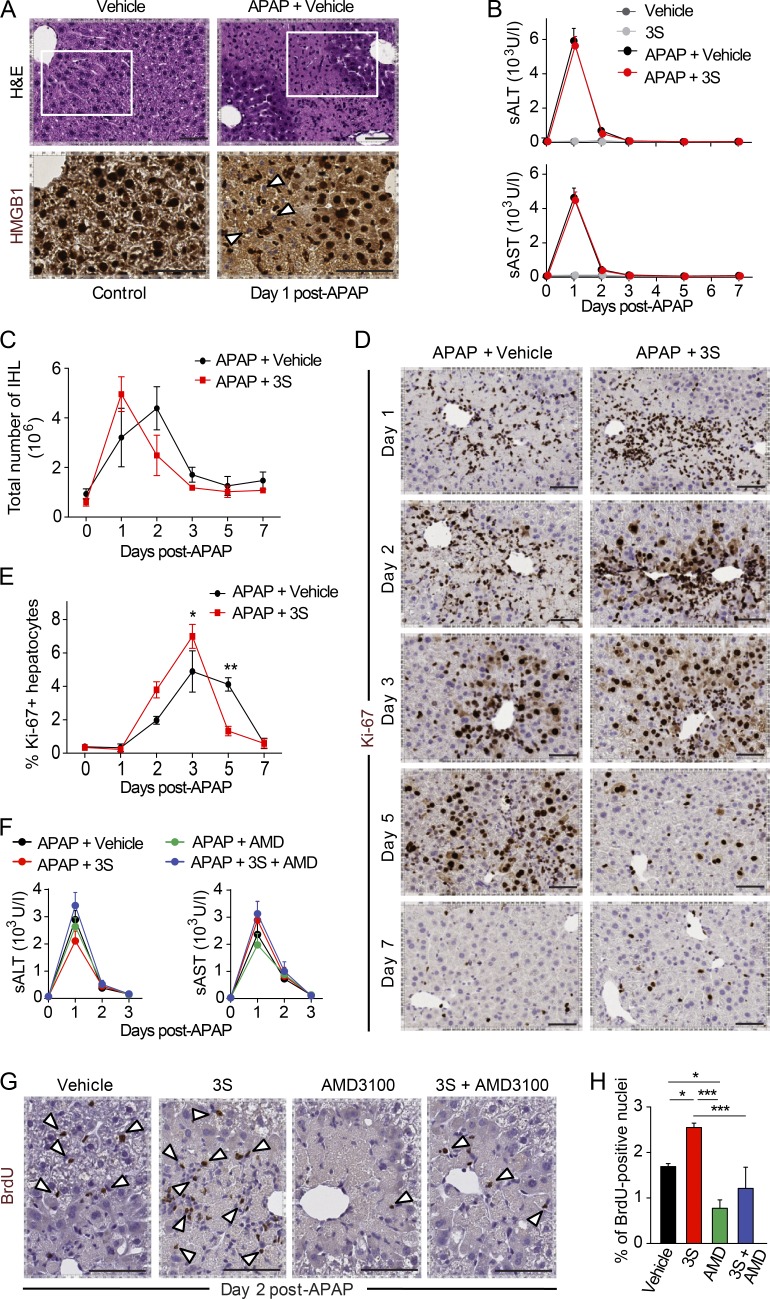
Figure 7.
3S accelerates liver regeneration via CXCR4. DILI was induced by i.p. injection of 300 mg/kg (body weight) APAP. 2 h later, mice received one single i.p. injection of vehicle (NaCl), 500 µg/mouse 3S, or 200 µg/mouse AMD3100 with or without 500 µg/mouse 3S. Serum collection and necroscopy were performed at different time points, and hepatic regeneration was assessed by i.p. injection of 1 mg/mouse BrdU 16 h before liver collection. (A) Representative images of H&E staining and HMGB1 immunostaining of liver in control mice on day 1 after DILI. HMGB1 negative nuclei (white arrowheads) are visible at higher magnification of the areas identified by rectangles in APAP-treated mice. Bars, 50 µm. (B) sALT and sAST in serum after APAP injection in mice treated with vehicle or 3S. n = 6 mice per group, two independent experiments. (C) Quantification of intrahepatic leukocytes (IHL) at days 1, 2, 3, 5, and 7 after APAP injection in control mice and after DILI in mice treated with vehicle or 3S. n = 4 mice per group, two independent experiments. Data are means ± SEM, and differences between groups were assessed with two-way ANOVA plus Bonferroni post-tests. The interaction between treatment and time is not significant. (D and E) Representative images of Ki-67 immunostaining (D) and quantification of Ki-67–positive hepatocytes (E) in livers from mice treated with vehicle or 3S at days 1, 2, 3, 5, and 7 after APAP injection. Bars, 50 µm. n = 4 mice per group, two independent experiments. Data are means ± SEM, and differences between groups were assessed with two-way ANOVA plus Bonferroni post-tests. The interaction between treatment and time is significant (P = 0.0003). (F) sALT and sAST after APAP injection in mice treated with vehicle, 3S, or AMD3100 with or without 3S. n = 4 mice per group, two independent experiments. Differences between groups in B and F were assessed with one-way ANOVA plus Dunnett’s post-test. (G and H) Representative images of BrdU immunostaining (G; BrdU-positive hepatocytes indicated with white arrowheads) and quantification of BrdU-positive hepatocytes (H) in livers from mice treated with vehicle, 3S, or AMD3100 with or without 3S at day 2 after APAP injection. Bars, 50 µm. n = 4 mice per group. Data are means ± SEM, and differences between groups were assessed with one-way ANOVA plus Bonferroni post-tests. *, P < 0.05; **, P < 0.01; ***, P < 0.001.

