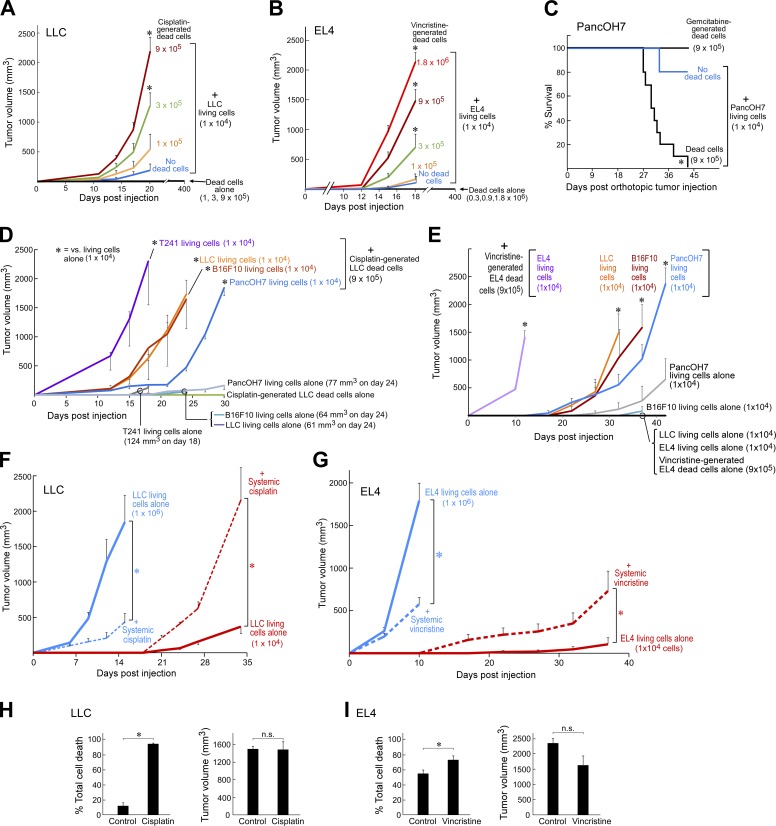
Figure 1.
Chemotherapy-generated tumor cell debris stimulates primary tumor growth. (A and B) Debris-stimulated LLC (A) and EL4 (B) tumor growth from chemotherapy-generated dead cells coinjected with a subthreshold inoculum of 104 living cells. n = 5–15 mice/group. Two-way repeated-measure mixed-effects ANOVAs for tumor growth rates and two-tailed Student’s t test for final tumor measurements were used throughout unless specified; *, P < 0.05 versus 104 living tumor cells alone (“No dead cells;” blue). (C) Percent survival of mice coinjected orthotopically into the pancreas with gemcitabine-generated PancOH7 dead cells and a subthreshold inoculum of PancOH7 living cells. n = 5 mice/group. *, P = 0.004 (Fisher’s exact test). Kaplan-Meier analysis indicated a significantly shortened survival of mice injected with a combination of dead and living cells as depicted by the area under the Kaplan-Meier survival curves (log-rank test = 9.14; *, P < 0.05). (D and E) Debris-stimulated tumor growth from cisplatin-generated LLC dead cells (D) coinjected with 104 LLC, B16F10, T241, or PancOH7 living cells as well as vincristine-generated EL4 dead cells (E) coinjected with 104 EL4, B16F10, LLC, or PancOH7 living cells. n = 5–10 mice/group. *, P < 0.05 versus corresponding living tumor cells alone. (F) Tumor growth from 106 versus 104 LLC living cells with systemic cisplatin. Chemotherapy was initiated on the day of tumor cell injection (dashed lines). n = 5–14 mice/group. *, P < 0.05 versus control (living tumor cells alone; solid lines). (G) Tumor growth from 106 versus 104 EL4 living cells with systemic vincristine. Chemotherapy was initiated on the day of tumor cell injection (dashed lines); n = 5–10 mice/group. *, P < 0.05 versus control (living tumor cells alone; solid lines). (H and I) Flow cytometry analysis for total cell death (sum of percent annexin V+ PI−, annexin V− PI+, and annexin V+ PI+) of comparable sized tumors from 104 LLC (H) or EL4 (I) living cells treated with systemic cisplatin or vincristine versus control (106 LLC or EL4 living cells). n = 4–6 mice/group; *, P < 0.05 versus control. Error bars represent SEM.

