Figure 7.
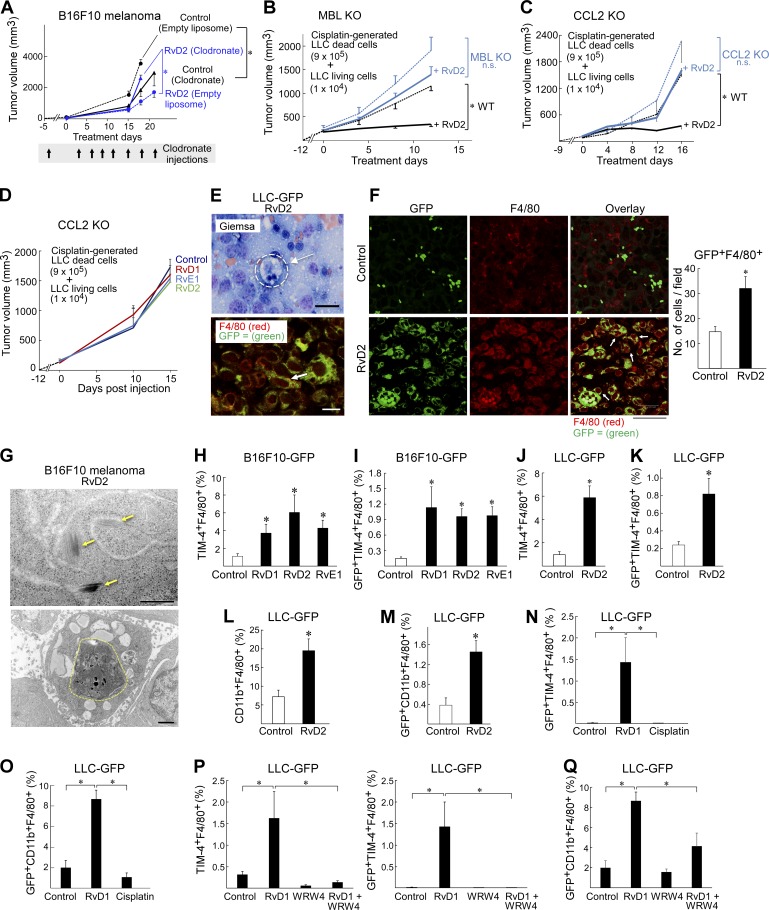
Antitumor activity of resolvins is macrophage dependent and induces a prophagocytic macrophage phenotype. (A) B16F10 (106 living cells) tumor growth after macrophage depletion with clodronate liposomes and RvD2 or vehicle treatment. n = 5–10 mice/group. Systemic RvD2 treatment was initiated on the day of tumor cell injection. Clodronate was administered 3 d before tumor cell injection and every 3 d thereafter for 21 d. Two-way repeated-measures mixed-effects ANOVAs for tumor growth rates and two-tailed Student’s t test for final tumor measurements were used throughout unless specified. *, P < 0.05. (B and C) Debris-stimulated LLC tumor growth in MBL KO (B) and CCL2 KO (C) mice with systemic RvD2 treatment. n = 5–7 mice/group. Resolvin treatment was initiated once tumors reached 100–200 mm3 throughout unless otherwise specified. *, P < 0.05 versus WT control (black dashed lines). (D) Debris-stimulated LLC tumor growth in resolvin or vehicle-treated CCL2 KO mice. n = 5–10 mice/group. (E) Giemsa staining of RvD2-treated LLC-GFP tumor (top); macrophage ingesting tumor cell (dashed circle). Immunofluorescent double-staining (bottom) for tumor cell marker GFP (green) and macrophage marker F4/80 (red) or colocalization of macrophages and tumor cells (yellow, indicated by arrows). (F) Immunofluorescent double staining for tumor cell marker GFP (green, left) and macrophage marker F4/80 (red, center) or colocalization of macrophages and tumor cells (macrophage phagocytosis indicated by arrows, right) in RvD2- or vehicle-treated LLC-GFP tumors on day 14 of treatment. Macrophage phagocytosis quantified by GFP+F4/80+ cells/field. Bars, 10 µm. *, P < 0.05 versus control. Images represent five sections each of four different samples. (G) Top: electron microscopy of RvD2-treated B16F10 tumors showing melanosomes (yellow arrows). Bottom: macrophage ingesting melanoma tumor cells (dashed circle). Bars: (top) 500 nm; (bottom) 1 µm. (H and I) Flow cytometry analysis of resolvin (RvD1, RvD2, or RvE1) versus vehicle-treated B16F10-GFP tumors for efferocytic macrophages (percent TIM-4+F4/80+) and macrophage efferocytosis of tumor debris (percent GFP+TIM-4+F4/80+). GFP+ cells were gated on TIM-4+F4/80+ cell populations. Macrophage efferocytosis of tumor debris quantified as the proportion of GFP+TIM-4+F4/80+ cells in each tumor sample. n = 4 mice/group. *, P < 0.05 versus control. (J and K) Flow cytometry analysis of efferocytic macrophages (TIM-4+F4/80+) in RvD2 versus vehicle-treated LLC-GFP tumors. GFP+ cells were gated on TIM-4+F4/80+ cell populations. Macrophage phagocytosis of tumor debris quantified as the proportion of GFP+TIM-4+F4/80+ cells in each tumor sample. n = 4 mice/group. *, P < 0.05 versus control. (L) Flow cytometry analysis of phagocytic macrophages (CD11bhighF4/80+) in RvD2- versus vehicle-treated LLC-GFP tumors. n = 6 mice/group. *, P < 0.05 versus control. (M) Macrophage phagocytosis of tumor debris quantified as the proportion of GFP+CD11b+F4/80+ cells in each tumor sample. GFP+ cells were gated on CD11b+F4/80+ cell populations. n = 3–6 mice/group. *, P < 0.05 versus control. (N) Flow cytometry analysis of LLC-GFP tumors treated systemically with RvD1 or cisplatin. GFP+ cells were gated on TIM-4+F4/80+ cell populations. Macrophage efferocytosis of tumor debris quantified as the proportion of GFP+TIM-4+F4/80+ cells in each tumor sample. n = 4–5 mice/group. *, P < 0.05 versus control. (O) Flow cytometry analysis of LLC-GFP tumors treated systemically with RvD1 or cisplatin. Macrophage phagocytosis of tumor debris quantified as the proportion of GFP+CD11b+F4/80+ cells in each tumor sample. n = 4–5 mice/group. *, P < 0.05 versus control. (P) Flow cytometry analysis of efferocytic macrophages (TIM-4+F4/80+; left) in LLC-GFP tumors treated systemically with RvD1 and/or WRW4. GFP+ cells were gated on TIM-4+F4/80+ cell populations. Macrophage efferocytosis of tumor debris quantified as the proportion of GFP+TIM-4+F4/80+ cells in each tumor sample (right). n = 4–5 mice/group. *, P < 0.05 versus control. (Q) Flow cytometry analysis of phagocytic macrophages (GFP+CD11b+F4/80+) in LLC-GFP tumors treated systemically with RvD1 and/or WRW4. Macrophage phagocytosis of tumor debris quantified as the proportion of GFP+CD11b+F4/80+ cells in each tumor sample. n = 4–5 mice/group. *, P < 0.05 versus control or RvD1. Data are representative of two biological repeats. Error bars represent SEM.

