Figure 1.
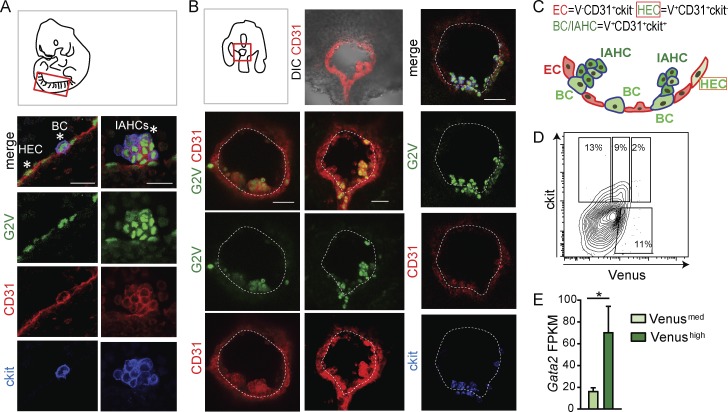
G2V reporter reveals expression of Venus in different EHT cell subsets. (A) Diagram of a whole mount of a 35-SP embryo with the dorsal aorta outlined in red and confocal images of the ventral aspect of the G2V dorsal aorta. HECs and BCs (left) and IAHCs (right) are indicated by asterisks (CD31, red; ckit, blue; and Venus, green). Bars, 20 µm. (B) Diagram of an embryo (33–34 SPs) transversal slice prepared for vital confocal time-lapse imaging. Confocal images of representative immunostained G2V embryo traversal sections (CD31, red; ckit, blue; and Venus, green). Bars, 40 µm. Ventral side downward. DIC, differential interference contrast. (C) Schematic representation of Gata2 (green) expression in the different EHT cell subsets in the E10.5 mouse dorsal aorta (ventral aspect; ECs, red, red outline; HECs, light green, red outline; BCs, medium green, blue outline; and IAHCs, dark green, blue outline). Cells with blue outline express ckit in addition to CD31. (D) Flow cytometric contour plot of CD31 gated cells. Percentages of CD31+ckit+Venusmed and CD31+ckit+Venushigh expressing cells from E10.5 G2V AGMs. (E) Bar graph of Gata2 transcription in E10.5 AGM G2V sorted CD31+ckit+Venusmed (light green) and CD31+ckit+Venushigh (dark green) cells. y axis shows FPKM values obtained from RNA-sequencing analysis. The data represent the mean ± SEM of three independent experiments and were compared using a Student’s t test (*, P = 0.0431).

