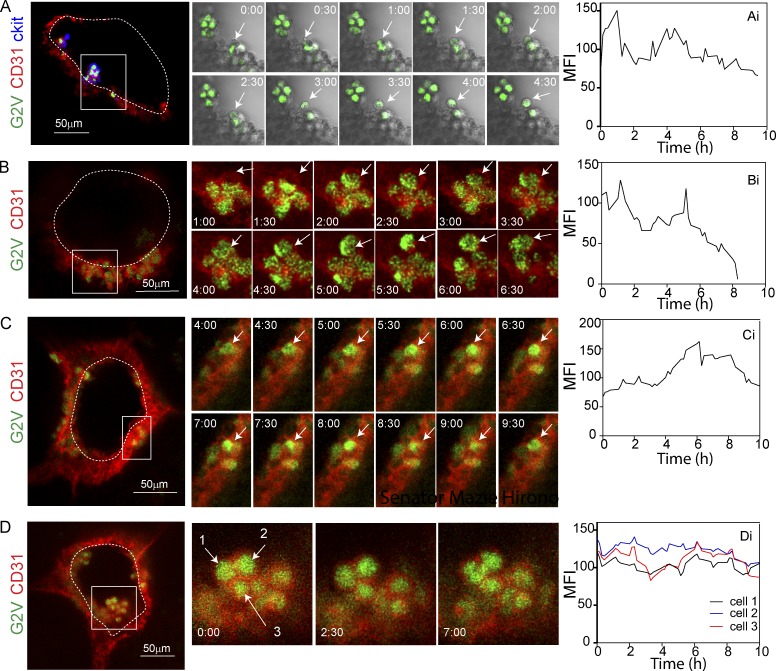
Figure 2.
Dynamic expression of the Gata2 reporter during EHT. (A–C) Confocal time-lapse imaging of E10 (33–34 SPs) G2V embryos (Venus, green) immunostained with anti–CD31 (red) and anti–ckit (blue) antibodies (A) or anti–CD31 (red) antibody only (B and C). Arrows indicate cells undergoing EHT events. (D) Confocal time-lapse imaging of IAHC at E10 (33–34 SPs; Venus, green), immunostained with anti–CD31 (red) antibody. Arrows indicate three IAHC cells. (Ai–Di) Quantification of Venus MFI over time (hours) corresponding to the highlighted cells during the process of EHT (Ai–Ci) and in IAHC (Di). Transverse aortic sections were imaged for 10 h at 15-min intervals. A–C (middle) show 30-min snapshots, and D shows snapshots at 0, 2.5, and 7 h. Bars, 50 µm.

