Figure 4.
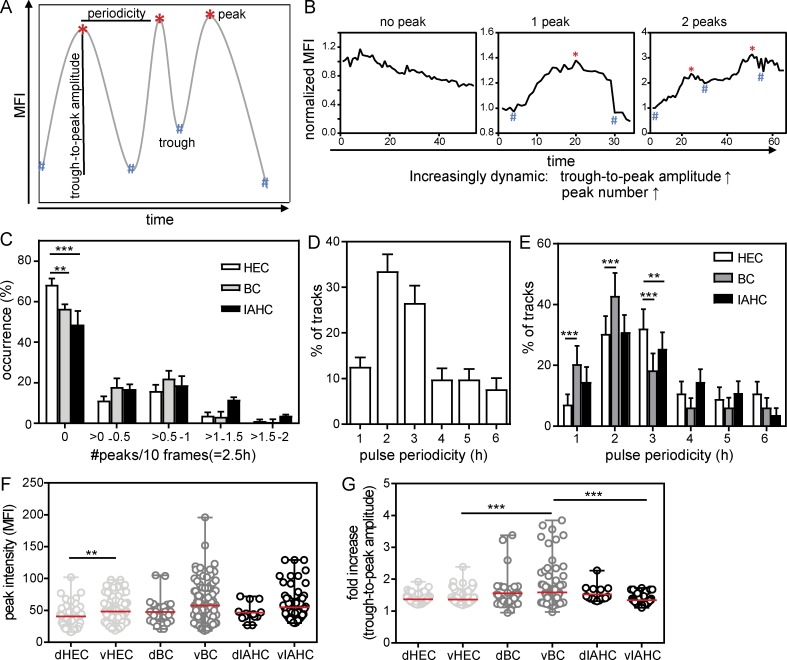
Pulse frequency and amplitude of Venus expression distinguishes EHT subsets. (A) Schematic representation of the automatic peak detection code. A local MFI maximum is considered a peak if it has at least a 15% higher intensity than its neighboring minima (see Materials and methods). The pulse period is the time between two adjacent peaks and the trough-to-peak amplitude the change between peak (highest value) and the preceding trough (lowest value). (B) Examples of normalized MFI profiles with no peak, one peak, and two pulse peaks showing increasing trough-to-peak amplitudes. (C) Distribution of the occurrence (percentage) of normalized pulse peak numbers in ECs, BCs, and IAHCs tracked over at least 10 consecutive frames (718 cells). To normalize for differences in track length, the data are presented as peaks per 10 frames (2.5 h) and represent the mean ± SEM (n = 15). Statistical significance was calculated using two-way ANOVA with Bonferroni post test (**, P < 0.01; ***, P < 0.001). (D) Distribution of the pulse periodicities of Venus+ cells showing at least two pulse peaks (n = 15, 221 cells). (E) Distribution of the pulse periodicities in EHT subset cells showing at least two pulse peaks (n = 15, 86 HECs, 80 BCs, and 55 IAHCs). The data represent the mean ± SD. Statistical significance was calculated on the pooled data (n = 15) using two-way ANOVA with Bonferroni post test (**, P ≤ 0.01; ***, P < 0.001). (F and G) Peak intensity (F) and trough-to-peak amplitude (G) in the EHT cell subsets, plotted according to their ventral (v) or dorsal (d) location in the aorta (n = 13, cells showing at least one peak: 170 HECs, 151 BCs, and 65 IAHCs). The data represent the mean ± range. Statistical significance was calculated on the pooled data (n = 15) using Mann–Whitney U test (**, P = 0.0054; ***, P < 0.0008).

