Figure 6.
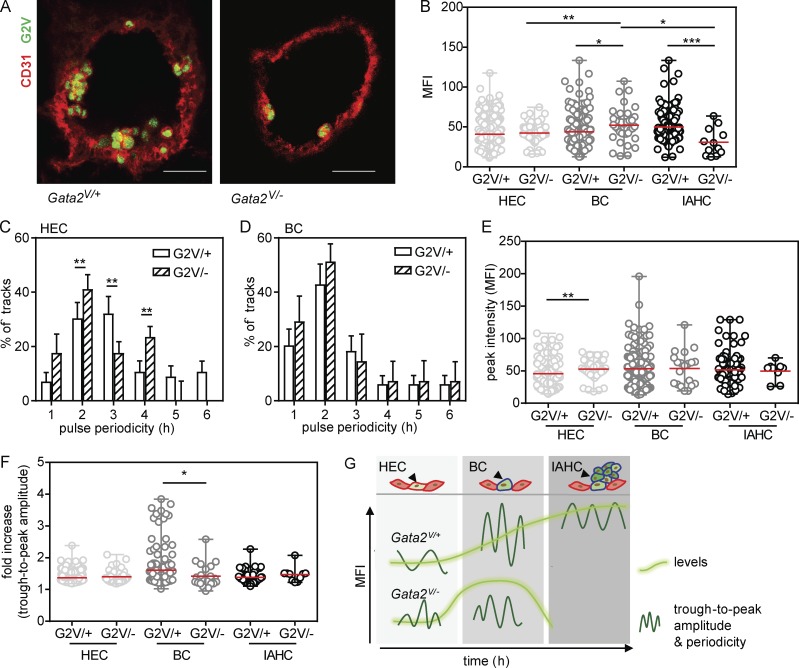
Gata2 expression parameters, hematopoietic fate, and EHT are interrelated. (A) Maximum projections of confocal time-lapse images of E10.5 Gata2V/+ and Gata2V/− aortas immunostained with anti-CD31 (red; G2V, green). Bars, 40 µm. Gata2V/+ and Gata2V/− embryos were harvested from the same litter. Ventral side downward. (B) Venus MFI (averaged over frames 3–12) in single Gata2V/- EHT subset cells (n = 6; 75 ECs, 37 BCs, and 12 IAHCs). The data were compared with Gata2V/+ EHT subset cells using one-way ANOVA with Bonferroni post test (mean ± SD; *, P ≤ 0.024; **, P = 0.0085; ***, P = 0.0003). (C and D) Distribution of the pulse periodicities in Venus+ EHT subset cells: HECs (C) and BCs (D) from E10.5 Gata2V/− aortas showing at least two pulsatile peaks (n = 6; 18 HECs and 15 BCs). The data represent the mean ± SD. The data were compared with Gata2V/+ HECs and BCs using two-way ANOVA with Bonferroni post test (**, P < 0.01). (E and F) Peak intensity (E) and trough-to-peak amplitude (F) in the Gata2V/− EHT subsets (n = 6, cells showing at least one peak: 36 ECs, 20 BCs, and 6 IAHCs). The data represent the mean ± range. The data were compared with Gata2V/+ EHT subset cells using Mann–Whitney U test (*, P = 0.0321; **, P = 0.0056). (G) Model of Gata2 expression dynamics and pulsatile characteristic during EHT. EHT cell types (top) are shown with accompanying Gata2 dynamic expression changes EHT directly below. G2V MFI (bright green) and pulse parameters (dark green sinusoids) are shown for Gata2V/+ (middle) and Gata2V/− (bottom) EHT subset cells.

