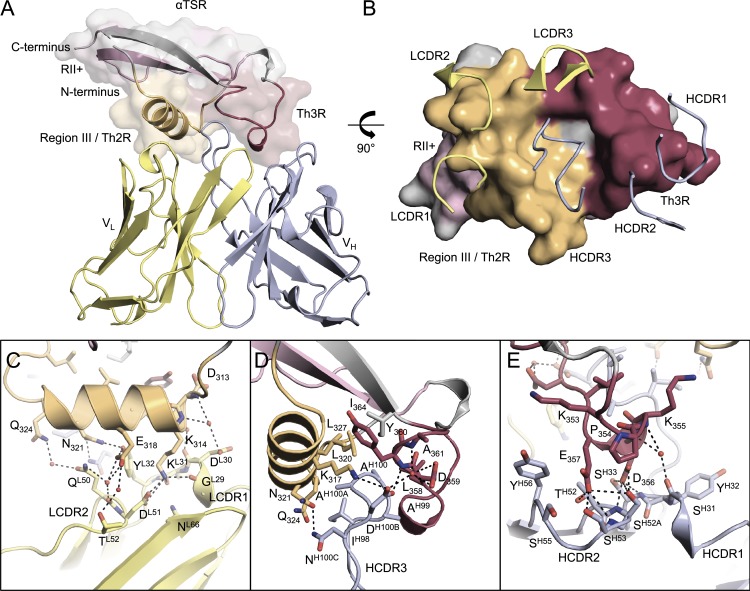
Figure 3.
Crystal structure of the PfCSP αTSR domain in complex with 1710 Fab. (A) The 1710 Fab variable regions bound to PfCSP αTSR. Region III/Th2R, region II+, and Th3R are orange, pink, and maroon, respectively. (B) CDR loops interacting with the Th2R and Th3R regions of PfCSP αTSR. LCDRs predominantly interact with the Th2R peptide (orange), whereas HCDRs predominantly interact with the hydrophobic core and the Th3R peptide (maroon). (C–E) PfCSP αTSR interactions with LCDRs (C), HCDR3 (D), and HCDR1/2 (E) loops. Hydrogen bonds are denoted as black dashed lines.

