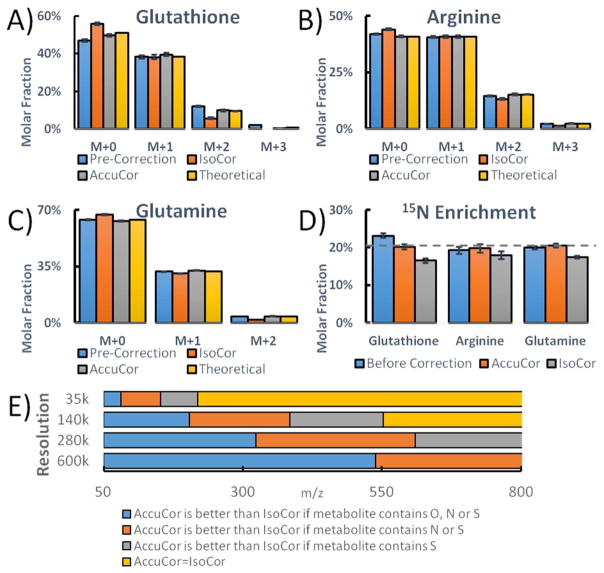
Figure 5.
The comparison of correction methods. A–C) The labeling patterns of glutathione, arginine and glutamine before and after correction are plotted. The theoretical pattern is calculated based on the experimental condition of 20% 15N enrichment. D) 15N enrichment is calculated from the labeling patterns (n=6, mean ± s.d.). The experimentally introduced enrichment of 20% is shown by the dashed line. E) Performance of AccuCor and IsoCor as a function of analyte m/z and atomic composition and mass spectrometer resolving power.

