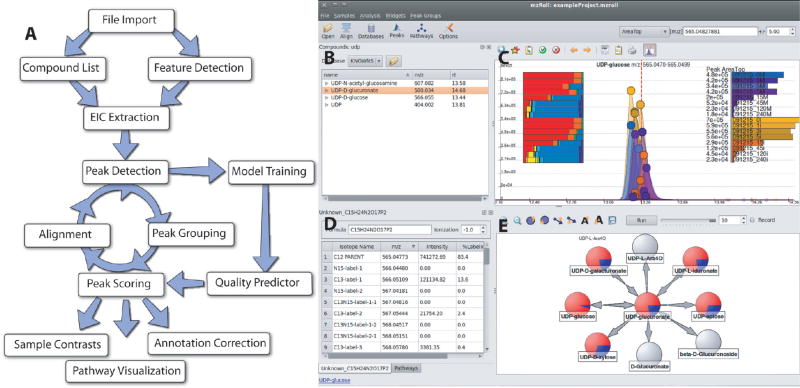
Figure 1.
Software overview. (A) General workflow. The program will automatically extract ion-specific chromatograms (EICs), assign peak quality scores, align peaks, and visually display data. The program is designed to allow an analyst to intervene at all stages. This facilitates correct annotation of detected features to compounds. (B–D) Screenshot of user interface. Shown is one common screen layout using UDP-glucose as a model compound. Subcomponents are (B) table of compounds with known retention times, (C) EIC centered on m/z and retention time of UDP-glucose, (D) table of isotope-labeled forms of UDP-glucose, and (E) reactions of UDP-glucose. All aspects are interlinked to enable efficient mouse-driven navigation through complex metabolomics data. For example, clicking on a different compound from the list in part B would automatically update screens C–E.

