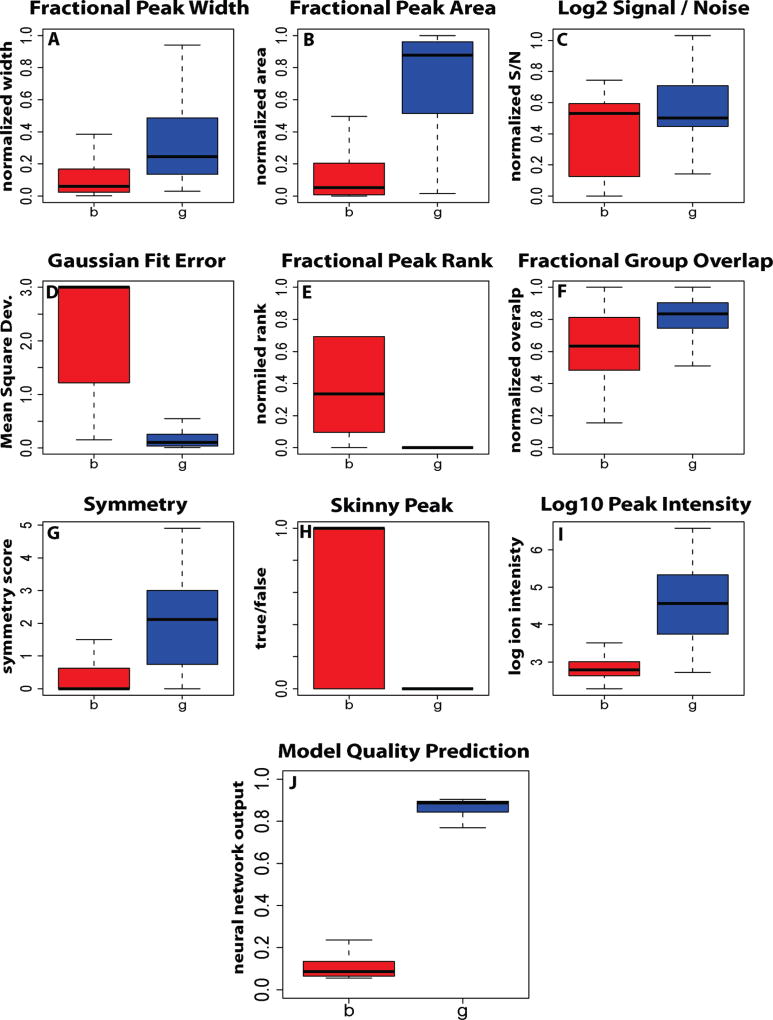
Figure 2.
Classification performance of various peak features used in automatic peak quality assessment. Blue, peaks that were manually annotated as high quality; red, peaks that were manually annotated as low quality. Dark lines, median; boxes, interquartile range; error bars, 95% limits. The strength of any individual feature depends on an ability to separate into two classes, “g” good peaks and “b” bad peaks. The integrated output of all features via neural network is capable of separating two classes with greater than 95% accuracy at the 0.5 cutoff line. Detailed definitions of features are provided in Supplementary Figure 2 in the Supporting Information.

