Figure 4.
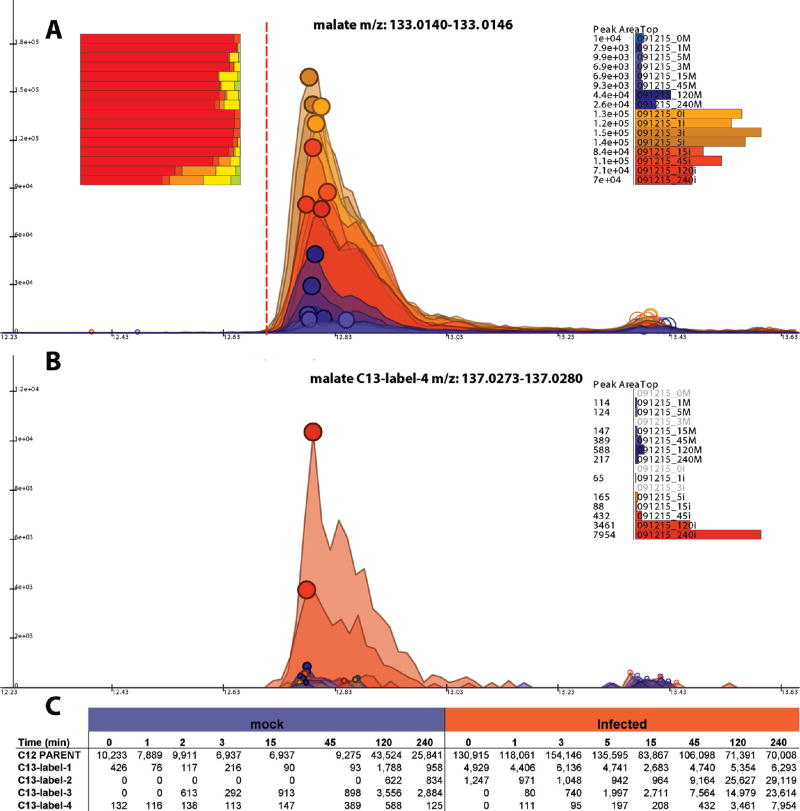
Visualization of raw LC–MS data. (A) Extracted ion chromatograms (EICs) for unlabeled malate (deprotonated anion). The red vertical line indicates the anticipated retention time of malate. The data comes from a 13C-glucose labeling time course in uninfected fibroblasts (blue) and HCMV infected ones (orange). The size of the filled circles on top of the peaks is proportional to the peak quality score. All of the peaks have large circles indicative of high peak quality. The bar chart on the right shows peak areas. The bar chart on the left shows the fraction of different labeled forms (red, unlabeled; orange-red, 13C1; orange, 13C2; yellow, 13C3; yellow-green, 13C4). The fractional labeling increases with longer labeling time. The increase is greater in the virally infected cells. Clicking on a bar corresponding to a labeled form brings up the associated set of EICs, as shown in part B for the fully labeled (13C4) malate. Right clicking brings up the table of peak areas for all samples and labeling states, as shown in part C. This table can be exported to a spreadsheet via a mouse click.

