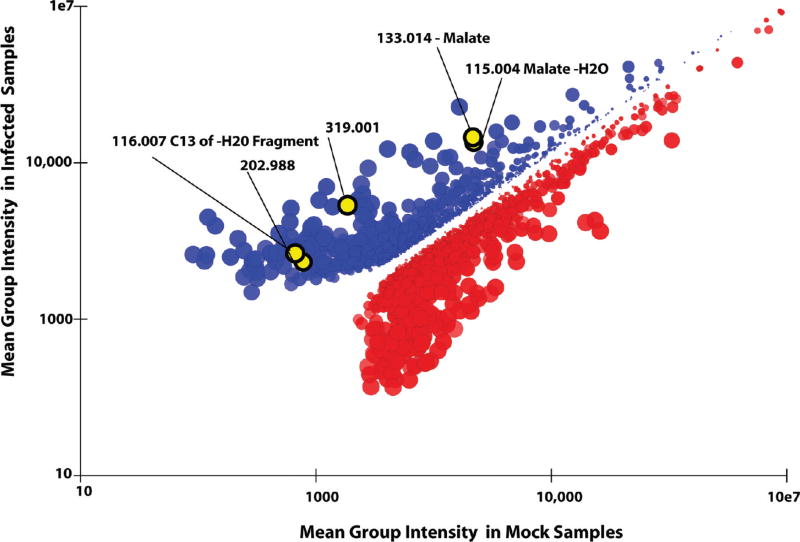
Figure 6.
Pairwise sample comparison. Each point corresponds to a peak group, with the X-value the mean peak intensity in uninfected samples and the Y-value the mean peak intensity in virally infected samples. The size of the points is proportional to fold difference between mean intensities. Points are colored red if the mean peak intensity in set 1 (mock) is greater than the mean in set 2 (viral). The intensity of color is proportional to p-values, based on the formula below. Only groups with at least a 2-fold difference are shown. Highlighted in yellow are groups corresponding to isotopes, potential adducts, and fragments of malate. Clicking on the point corresponding to malate leads to automatic highlighting of these related compounds. The color intensity equals to 1.0 – (p-value0.2).

