
Figure 1. Glutamine-Derived ammonia is recycled.
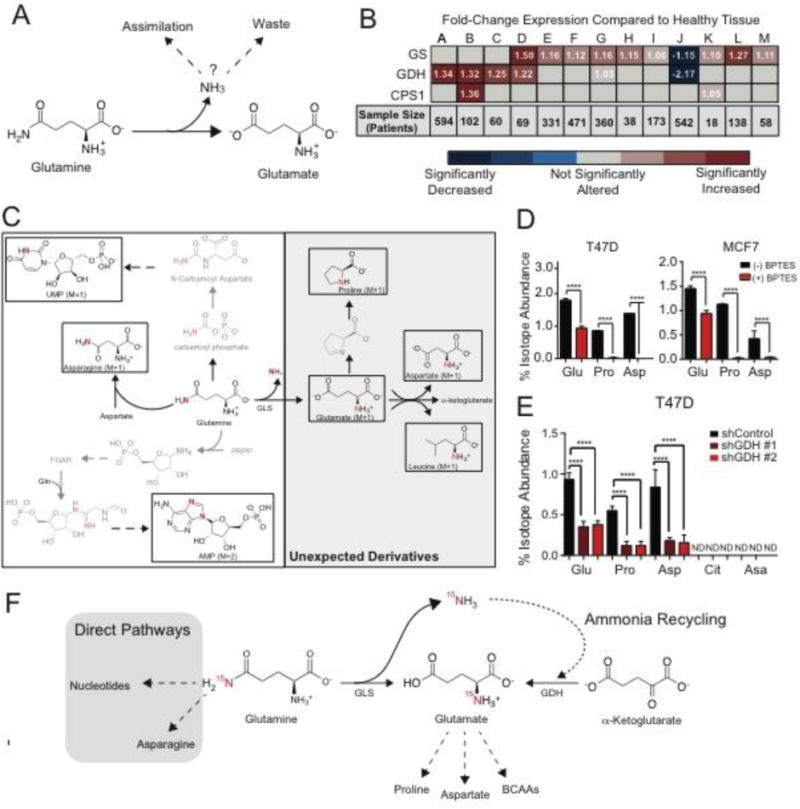
A. Schematic of fates of ammonia in cancer. B. mRNA expression of ammonia-assimilating enzymes from The Cancer Genome Atlas in cancer compared to its normal tissue. Fold-change (cancer/normal) for GS (Glutamine Synthetase), GDH1 (Glutamate Dehydrogenase), and CPS1 (Carbamoyl Phosphate Synthetase 1) RNA levels were assessed using Oncomine.org. Values are the mean of fold change (cancer/normal) measured across the number of patients listed. (A) Ovarian Serous Cystadenocarcinoma, (B) Colon Adenocarcinoma, (C) Rectal Adenocarcinoma, (D) Lobular & Ductal Breast Carcinoma, (E) Lung Adenocarcinoma, (F) Squamous Lung Cell Carcinoma, (G) Endometrial Adenocarcinoma, (H) Bladder Urothelial Carcinoma, (I) Gastric Adenocarcinoma, (J) Glioblastoma, (K) Pancreatic Adenocarcinoma, (L) Hepatocellular Carcinoma, (M) Cutaneous Melanoma. C. Schematic of 15N-isotopologues after treatment with 15N-(amide)glutamine. D. Isotopologue abundance of unexpected 15N-(amide)glutamine derivatives +/− 1 uM BPTES in T47D and MCF7 cell lines. Values represent mean +/− SEM, n=4 per condition. E. Isotope abundance of 15N-(amide)glutamine-derived metabolites in control cells and cells depleted of GDH (shGDH#1 & shGHD#2). ND= 15N-Isotopologue not detected. Glu = Glutamate M+1, Pro = Proline M+1, Asp = Aspartate M+1, Cit = Citrulline M+1, Asa = Argininosuccinate M+1. Values represent mean +/− SEM, n=4 per condition. F. Schematic of ammonia recycling. For all comparisons two-tailed t test was used. *P < 0.05, **P < 0.01, ***P<0.001, ****P<0.0001.