
Figure 2. Ammonia is assimilated by GDH to generate amino acids.
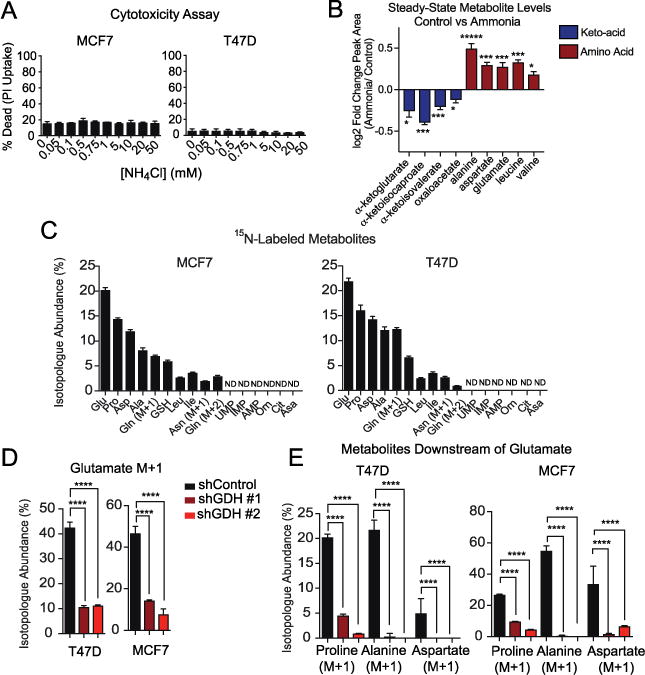
A. Propidium Iodide (PI) staining of cells treated with a dose of NH4Cl for 48 hours. Values represent mean +/− SEM, n=3. Representative experiment of three replicates. B. Heat map of fold-change in steady-state abundance of keto- and amino acids involved in transaminase reactions in T47D cells treated with 0.75 mM NH4Cl. Values represent mean +/− SEM, n=4. Representative experiment of two replicates. C. Abundance of 15N-isotopologues in MCF7 and T47D cells after 8 hours of treatment with 0.75 mM 15NH4Cl. (M+1) indicates a single nitrogen labeled and (M+2) indicates two nitrogen labeled. Values are scaled to account for total intracellular ammonia and represent mean +/− SEM, n=4. D. Isotopologue abundance of glutamate (M+1) in MCF7 and T47D cells treated for 8 hours with 0.75 mM 15NH4Cl in control and GDH-depleted cells. Values are scaled to account for total intracellular ammonia and represent mean +/− SEM, n=4. E. Abundance of 15N-isotopologues for metabolites downstream of glutamate treated for 8 hours with 0.75 mM 15NH4Cl in control and GDH depleted cells. Values are scaled to account for total intracellular ammonia and represent mean +/− SEM, n=4. For all comparisons two-tailed t test was used. *P < 0.05, **P < 0.01, ***P<0.001, ****P<0.0001.