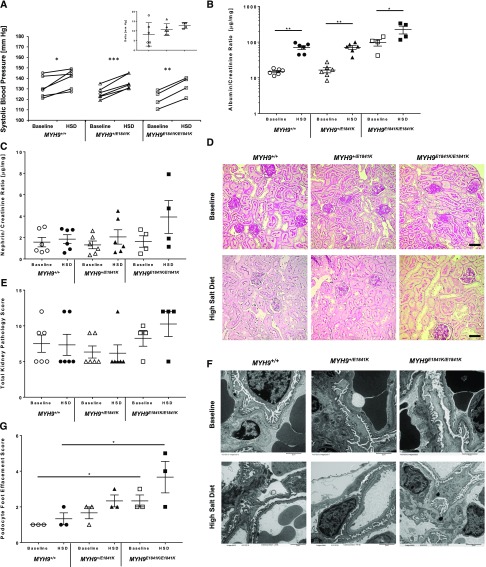
Figure 1.
MYH9 E1841K mutation increases susceptibility to proteinuria and podocyte foot effacement after high salt exposure. (A) Mean SBP at baseline and after HSD. SBPs were measured daily × ten measurements, averaged over a period of 2 weeks for each mouse. Mean of means of SBP (in mm Hg) for each genotype group at baseline are: MYH9 +/+ (n=6) 131.7±4.0, MYH9 +/E1841K (n=6) 125.9±2.3, MYH9E1841K/E1841K (n=4) 120.3±4.0; and after HSD: MYH9 +/+ 139.9±3.7, MYH9 +/E1841K 136.6±2.7, MYH9E1841K/E1841K 132.8±4.4; P=NS (ANOVA) between the three groups at baseline and after HSD. For comparison of HSD versus normal chow within group (by paired t test): P=0.02 for MYH9 +/+ (*), <0.001 for MYH9+/E1841K (***), and 0.001 for MYH9E1841K/E1841K (**). Insert shows mean change in SBP from baseline and after HSD, P=NS by ANOVA. (B) Mean urinary A/C ratio (micrograms per milligram, log scale) at baseline after 2 weeks of BP measurement: MYH9 +/+ 14.9±1.1, MYH9 +/E1841K 16.5±2.7, MYH9E1841K/E1841K 98.0±20.7; P<0.001 (ANOVA) among groups. After 2 weeks of HSD: MYH9 +/+ 70.6±8.8, MYH9 +/E1841K 71.2±8.7, MYH9E1841K/E1841K 224.2±55.3; P=0.002 (ANOVA) among groups. For comparison of HSD versus normal chow within groups (by paired t test), P≤0.002 for both MYH9 +/+ and MYH9 +/E1841K (**), and 0.05 for MYH9E1841K/E1841K (*). (C) Mean urinary N/C ratio (micrograms per milligram) at baseline: MYH9 +/+ 1.57±0.44, MYH9 +/E1841K 1.31±0.36, MYH9E1841K/E1841K 1.63±0.54; P=NS. After HSD: MYH9 +/+ 1.85±0.41, MYH9 +/E1841K 2.06±0.67, MYH9E1841K/E1841K 3.92±1.54; P=NS (ANOVA). (D) Representative periodic acid–Shiff staining of kidney sections (40×). Baseline: MYH9 +/+, MYH9 +/E1841K, and MYH9 E1841K/E1841K displayed similar renal histology. After HSD: MYH9 +/+, MYH9 +/E1841K, and MYH9 E1841K/E1841K, no observable changes in renal pathology were noted. Black scale bar=50 µm. (E) Mean total kidney pathology scores at baseline: MYH9 +/+ 7.5±1.2, MYH9 +/E1841K 6.3±0.8, MYH9E1841K/E1841K 8.3±1.1; P=NS. After HSD: MYH9 +/+ 7.3±1.5, MYH9 +/E1841K 6.2±1.2, MYH9E1841K/E1841K 10.3±1.8; P=NS. (F) Representative transmission EM images (6000×). Baseline: MYH9 +/+ mice showing normal podocyte FPs, MYH9 +/E1841K mice with rare FP effacement, MYH9 E1841K/E1841K with mild FP effacement. After HSD: MYH9 +/+ mice showing rare podocyte FP effacement, MYH9 +/E1841K mice mild FP effacement, and MYH9 E1841K/E1841K with a trend toward moderate FP effacement. (G) Mean podocytes FP effacement scores. Baseline (n=3 each): MYH9 +/+ 1.0±0.0, MYH9 +/E1841K 1.67±0.33, and MYH9E1841K/E1841K 2.33±0.33; MYH9E1841K/E1841K is significantly different from MYH9 +/+ mice; *P<0.02 by one-way ANOVA test. After HSD (n=3 each): MYH9 +/+ 1.33±0.33, MYH9 +/E1841K 2.33±0.33, MYH9E1841K/E1841K 3.67±0.88; P=NS (ANOVA).

