Figure 1.
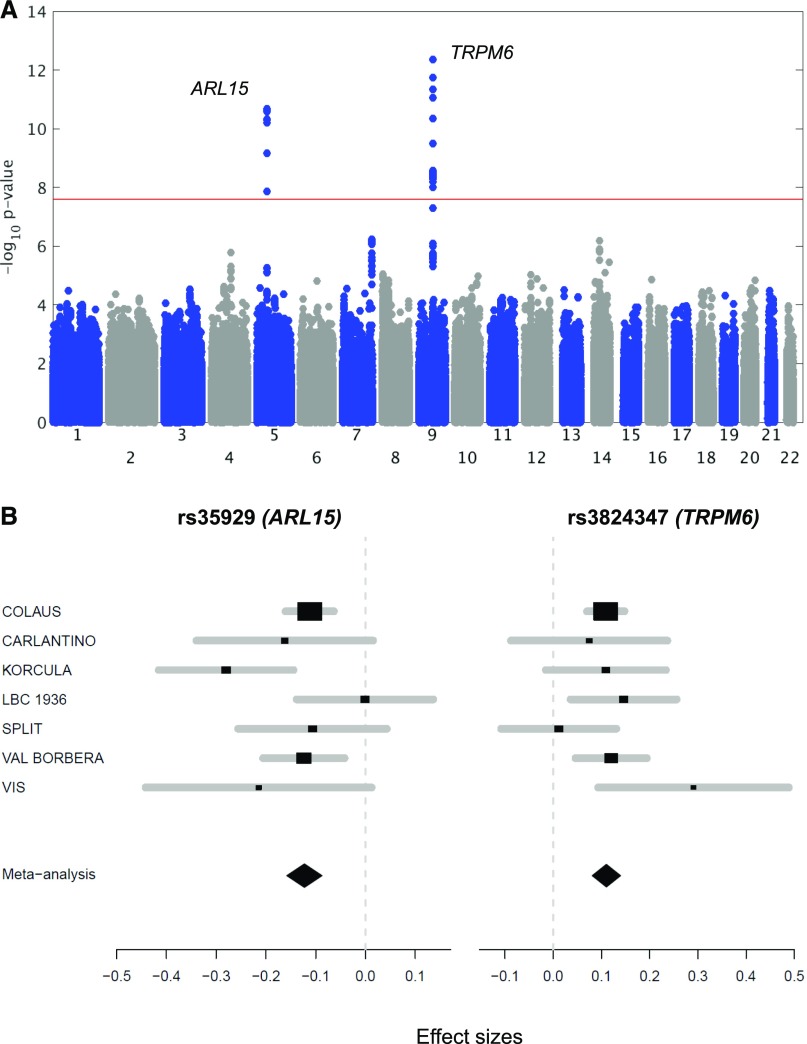
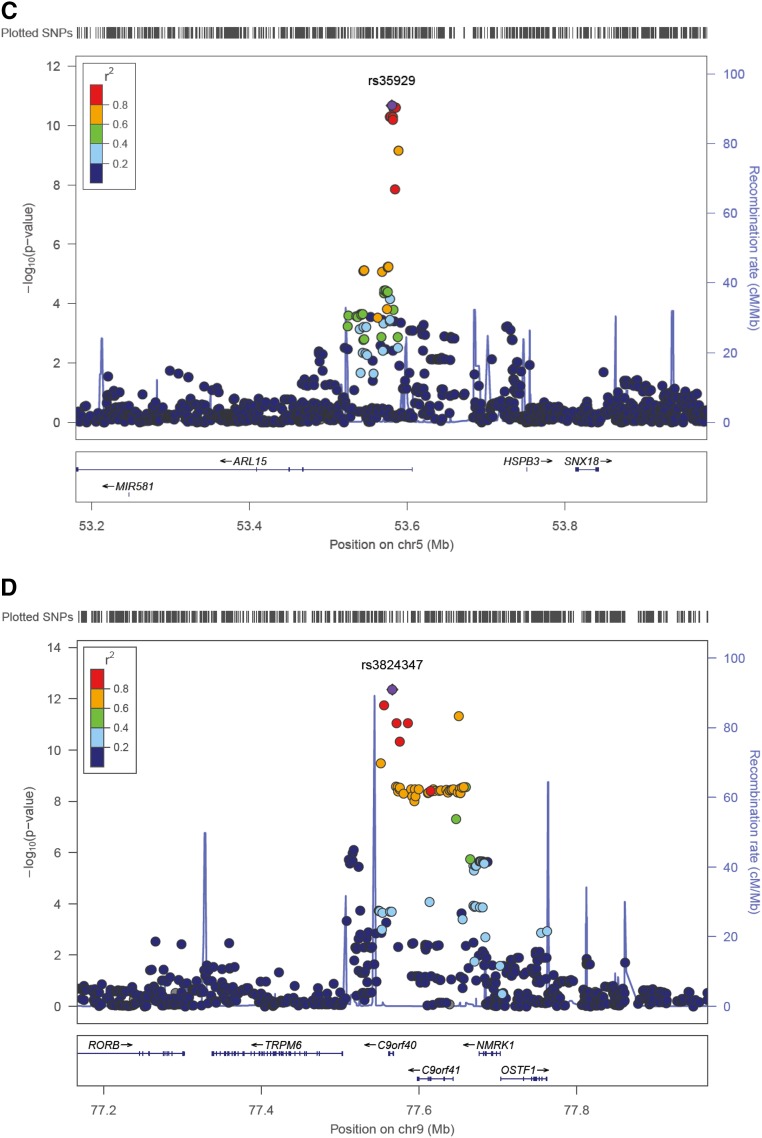
A genome-wide meta-analysis for urinary Mg2+-to-creatinine ratio reveals two signals. (A) Manhattan plot showing −log10(P values) for all SNPs in the genome-wide meta-analysis for normalized urinary Mg2+-to-creatinine ratio in Europeans (n=9099), ordered by chromosomal position. The values correspond to the association of normalized urinary Mg2+-to-creatinine ratio, including age and sex as covariates in the model as well as study-specific covariates if needed. The gene closest to the SNP with the lowest P value is listed at each locus. Two loci reached genome-wide significance (P<5×10⁻⁸), indicated by the red horizontal line, at combined analysis (TRPM6, rs3824347 and ARL15, rs35929). (B) Forest plot for rs35929 (ARL15) and rs3824347 (TRPM6) showing effect sizes and 95% confidence intervals across studies as well as the summary meta-analysis results. (C) Regional association plot at the rs3824347 (TRPM6) locus. Regional association plot showing −log10 (P values) for the association of SNPs at the locus of interest ordered by their chromosomal position with normalized urinary Mg2+-to-creatinine ratio. The -log10 (P value) for each SNP is colored according to the correlation of the corresponding SNP, with the SNP showing the lowest P value (index SNP) within the locus using different colors for selected levels of LD (chi-squared). Correlation structures correspond to HapMap 2 CEU. The blue line represents the recombination according to the scale shown on the right-side y-axis. (D) Regional association plot at the rs35929 (ARL15) locus.


