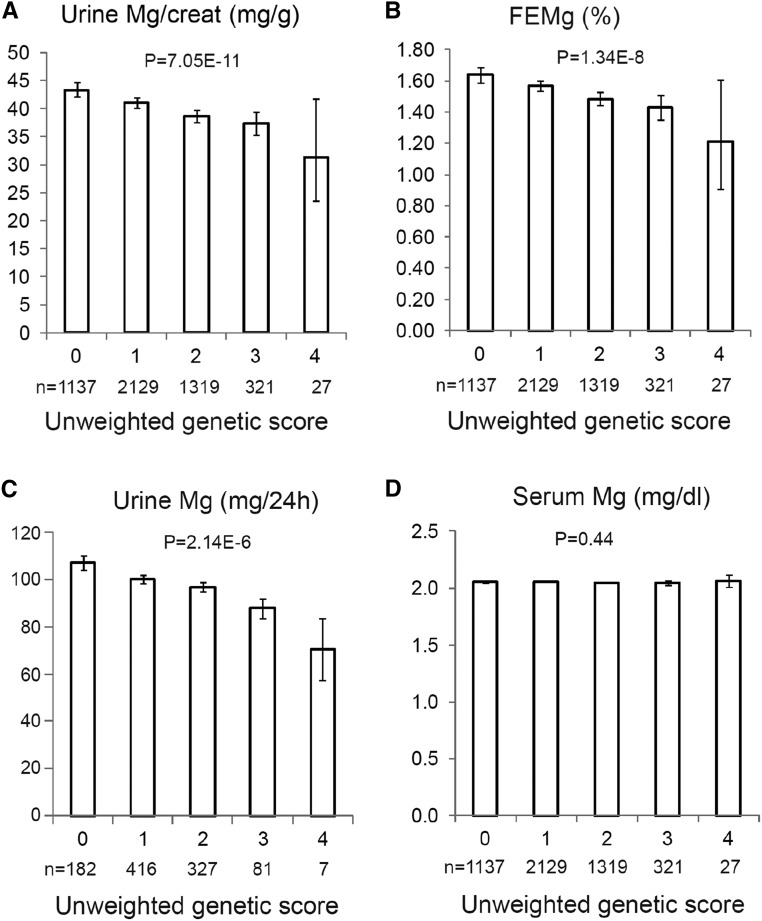
Figure 2.
A genetic score including rs35929 and rs3824347 associates with uMg traits. (A–D) Associations of uMg excretion and fractional excretion with an unweighted genetic risk score including rs35929 (ARL15 locus) and rs3824347 (TRPM6 locus). Data are geometric means and whiskers are 95% confidence intervals for Mg2+-related phenotypes in the CoLaus (A, B, D) and SKIPOGH (C) studies. The x-axes represent the unweighted genetic score generated from rs35929 and rs3824347, using as effect allele the one associated with lower urinary Mg2+-to-creatinine ratio, i.e., the A allele for rs35929 and the G allele for rs3824347. P values are from nonparametric trend tests across genetic score. The numbers in each genetic score category are listed in all panels. The y-axis represents urinary Mg2+-to-creatinine ratio (milligrams per gram) (A), FEMg (%) (B), uMg excretion (milligrams per 24 hour) (C), and serum Mg2+ (milligrams per deciliter) (D).

