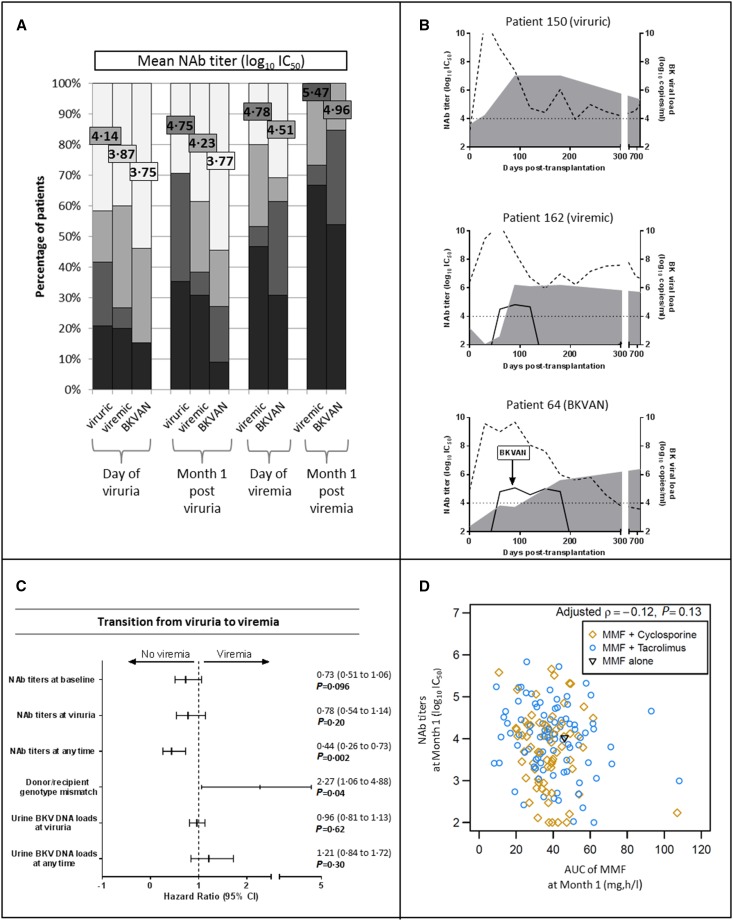
Figure 3.
A delayed and weak NAb response is associated with severe BK virus (BKV) infection outcome. (A) The evolution of NAb titers directed against the replicating strain in patients who were viruric, viremic, and those with BKVAN. NAb titer distribution is depicted in colored bars and mean NAb titer values (log10 IC50) for each group are represented by colored squares. (B) The detailed evolution of three representative patients of viruric, viremic, and BKVAN groups. Dotted and solid lines represent urine and blood viral loads, respectively. NAb titers are depicted by gray areas. (C) The association of NAb titers, donor/recipient genotype mismatch, and urine BKV DNA loads with the risk of transition from viruria to viremia state. Continuous or joint models were used. HR (95% CI) and P values were calculated using two-fold crossvalidation after section of the optimal cutoff at 4 log10 IC50 NAb titer. (D) Spearman’s rank correlation between NAb titers and mycophenolic acid (MMF) area under the concentration time curve (AUC), alone or associated to cyclosporine or tacrolimus. Spearman’s coefficient and associated P value are indicated.

