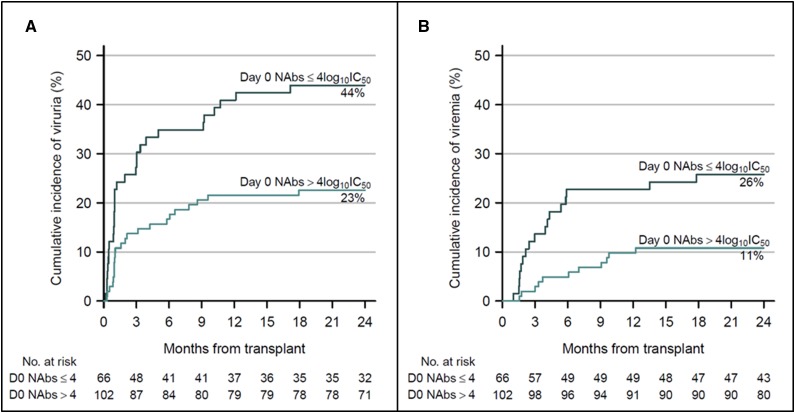
Figure 4.
Neutralizing titers before transplantation predict the development and outcome of BK virus (BKV) infection after transplantation. Kaplan–Meier curves represent (A) BKV viruria and (B) viremia cumulative incidence according to NAb titer (log10 IC50) at the time of transplantation (day 0 NAbs). Black curves indicate NAb titers ≤4log10 IC50 and green curves indicate NAb titers >4log10 IC50. Numbers at risk are indicated at each timepoint. Cumulative incidence values at month 24 are indicated.

