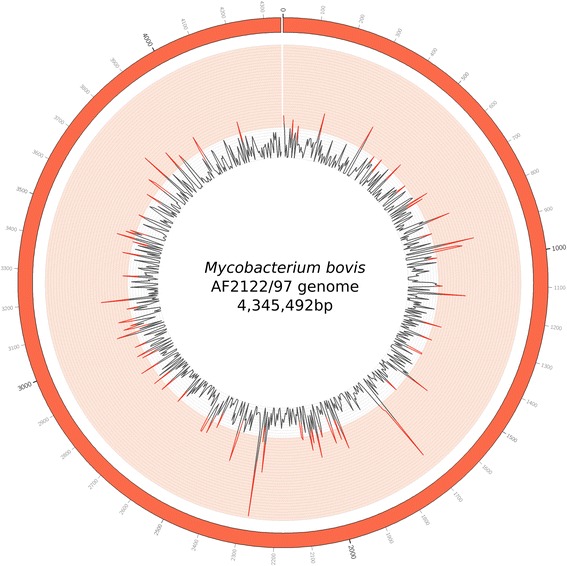
Fig. 4.

Visualization of the density of variants in the entire length of the reference genome (AF2122/97). Inner rays represent the variant density of every 5 kb region: a region that surpasses a density of 0.006 (innermost circle of the light red band) is significantly high density (binomial test, p < 0.001 after Bonferroni correction)
