
Fig. 3.
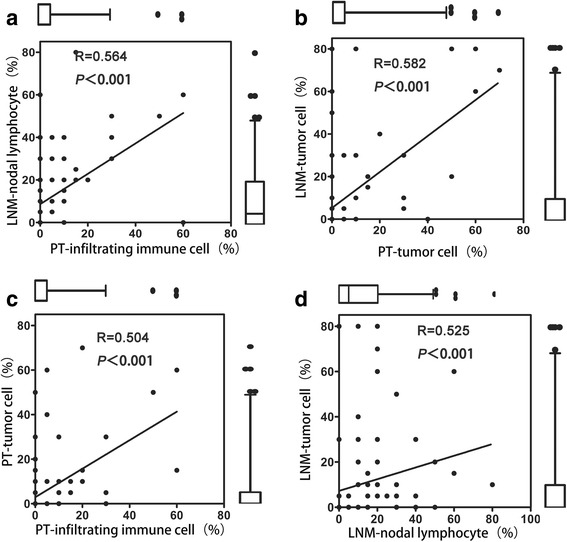
Comparison of the heterogeneity of PD-L1 expression between PTs and LNMs. The box plot shows the correlation between PD-L1 expression in tumor cells and infiltrating lymphocytes. The Wilcoxon signed-rank test for paired samples was performed to assess statistical significance. a Association between lymphocyte PD-L1 expression in matched PT and LNM specimens. Significantly higher expression was detected in the LNMs. b Association between tumor cell PD-L1 expression in matched PT and LNM specimens. Significantly higher expression was detected in the LNMs. c Correlation between PD-L1 expression in tumor cells and lymphocytes in PTs. No significant differences were observed. d Correlation between PD-L1 expression in tumor cells and lymphocytes in LNMs. No significant differences were observed