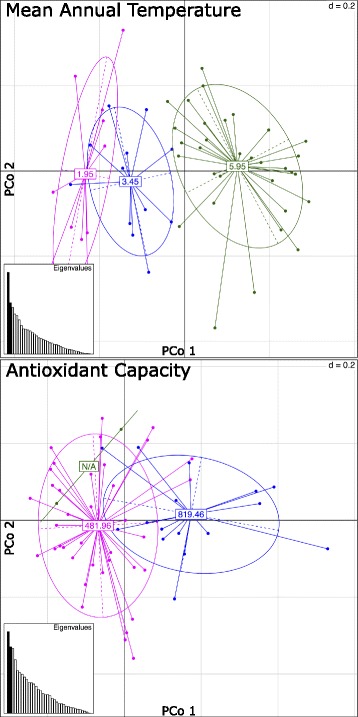
Fig. 4.

Principal Coordinates Analysis (PCoA) plots for two variables: MAT on top and AC on bottom. Dots represent individual samples and are colored based on the values of the corresponding environmental or phenotypic variable. Numbers at center of clusters are mean values for each group. X and Y-axes represent first and second multivariate coordinate (PCo1 and PCo2), respectively. d = 0.2 represents the mesh of the grid. Only the 50 and 42 SNPs associated with MAT and AC, respectively, were used to obtain the genetic distance between samples, and the clustering of the samples based on the variable values indicate that these SNPs are indeed correlated with these variables. The bar plot on the bottom left corner shows the eigenvalues
