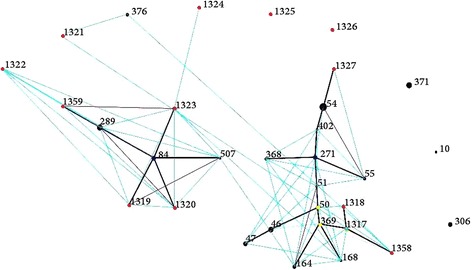
Fig. 1.

eBURST diagram representing the relatedness between 32 STs identified in 83 isolates. Black dot: existing ST. Red dot: novel ST. Blue dot: predicted group ancestor. Yellow dot: predicted subgroup ancestor. Green dot: novel and subgroup ancestor ST. Black and purple lines: single locus variants (SLVs). Blue line: double locus variant (DLV). Re-samplings for bootstrapping = 10,000; minimum number of identical loci for group definition =6; minimum number of SLV for subgroup definition =3. The size of the dot reflects the individual ST frequency among the 83 strains
