
Fig. 2.
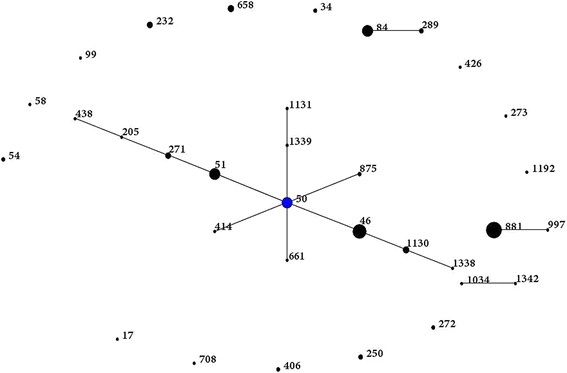
eBURST population snapshot for B. pseudomallei STs in Malaysia before conducting the present study. Blue dot refers to group founder. Each black dot represents single genotype. The size of the dot represents the ST frequency
Official websites use .gov
A
.gov website belongs to an official
government organization in the United States.
Secure .gov websites use HTTPS
A lock (
) or https:// means you've safely
connected to the .gov website. Share sensitive
information only on official, secure websites.
eBURST population snapshot for B. pseudomallei STs in Malaysia before conducting the present study. Blue dot refers to group founder. Each black dot represents single genotype. The size of the dot represents the ST frequency