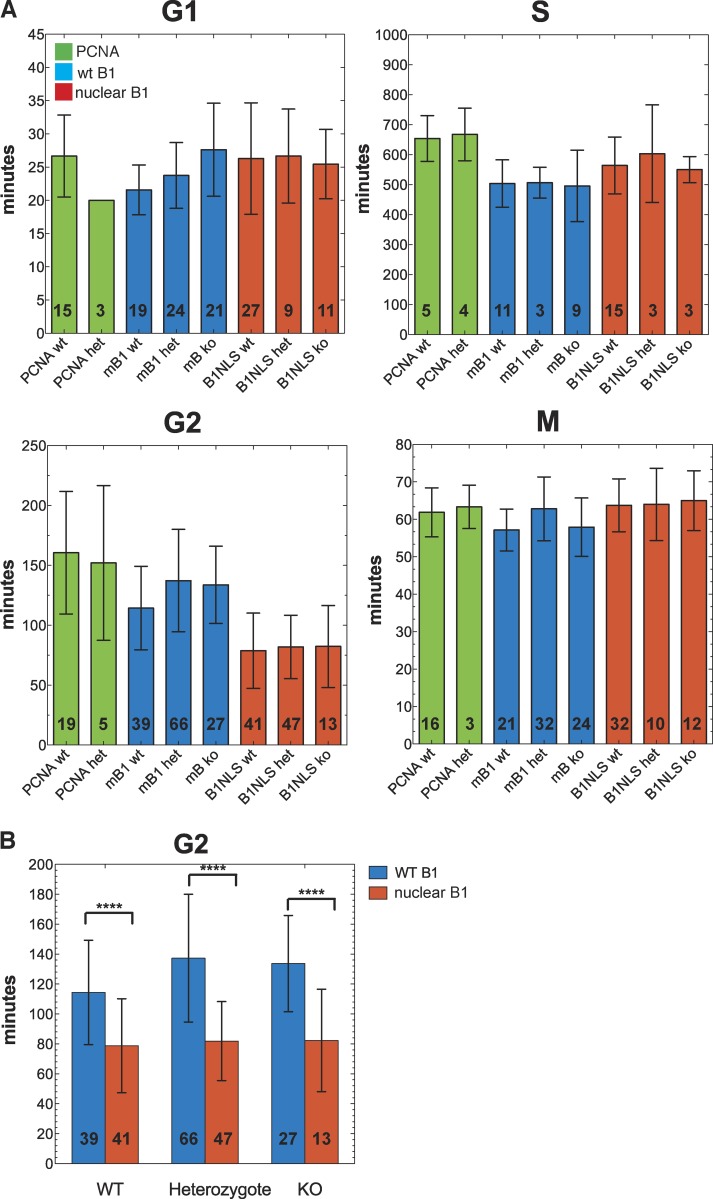
Figure 6.
Nuclear Cyclin B1 accelerates entry into mitosis. (A) The lengths of different phases of the cell cycle were quantified after injecting either PCNA alone (PCNA, green; three independent experiments), wild-type Cyclin B1 (mB1, blue; four independent experiments), or nuclear Cyclin B1 (B1NLS, red; five independent experiments). y axis shows time in minutes (mean; error bars represent ±SD of the mean) is shown for each of the genotypes: +/+ (wt), +/− (het), and −/− (ko). Numbers inside bars indicate number of divisions analyzed. (B) The greatest difference in timing between wild-type and nuclear Cyclin B1 was in G2 phase where nuclear Cyclin B1 reduced G2 length by ∼40% (P < 0.0001, two-sided t test; error bars: ±SD of the mean; ****, P < 0.0001).

