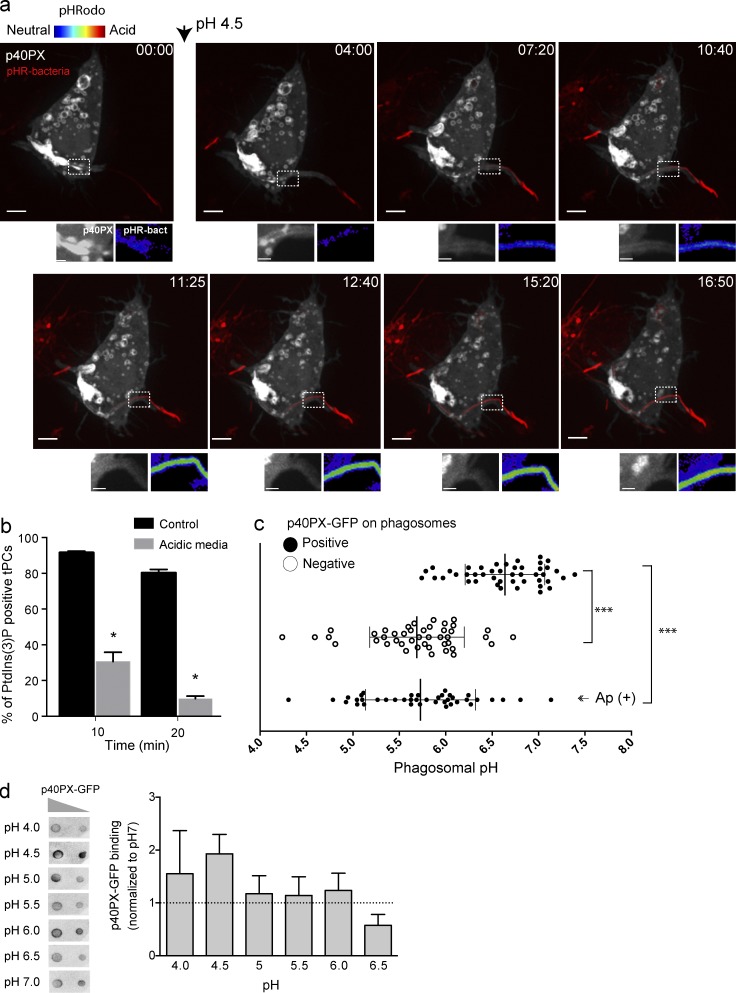
Figure 6.
Forced acidification divests PtdIns(3)P reporters from tPCs. (a) Selected frames from a time-lapse sequence from Video 4 showing a RAW macrophage expressing p40PX-GFP (white) engulfing a pHrodo-conjugated bacteria (turning red as it acidifies). Arrowhead indicates the time at which cells were exposed to culture media at pH 4.5. Images at the bottom of main panels show magnifications of the framed areas. Right panels show pHrodo signal (false-rainbow palette) and left panels show p40PX-GFP. Bars, 5 µm. (b) RAW cells expressing 2FYVE-GFP were challenged with filamentous bacteria in neutral or acidic conditions. After 10 and 20 min of phagocytosis, cells were imaged for accumulation of 2FYVE-GFP at tPCs. Data shown are means ± SEMs from three independent experiments (n = 20 for each; *, P < 0.05). (c) RAW cells expressing p40PX-GFP were challenged with pHrodo-conjugated filamentous bacteria. The phagosomal pH was determined for p40PX-GFP–positive and –negative phagosomes after 15 and 30 min of phagocytosis, respectively. (Ap+) cells were treated with 10 nM apilimod 1 h before phagocytosis and pH measured 30 min of phagocytosis. Data represent 15 phagosomal pH values ± SD from three independent experiments. ANOVA test was used to compare each group; ***, P < 0.001. (d) Binding of p40PX-GFP to PtdIns(3)P does not depend on pH. (Left) Protein-lipid overlay (PLO) using recombinant p40PX-GFP-Hisx6 and membranes containing 400 and 200 pmols of PtdIns(3)P. This is a representative of three independent experiments. (Right) Densitometry of spots from PLOs expressed relative to that observed at pH7, expressed as means ± SEMs of three independent experiments.

