Figure 8.
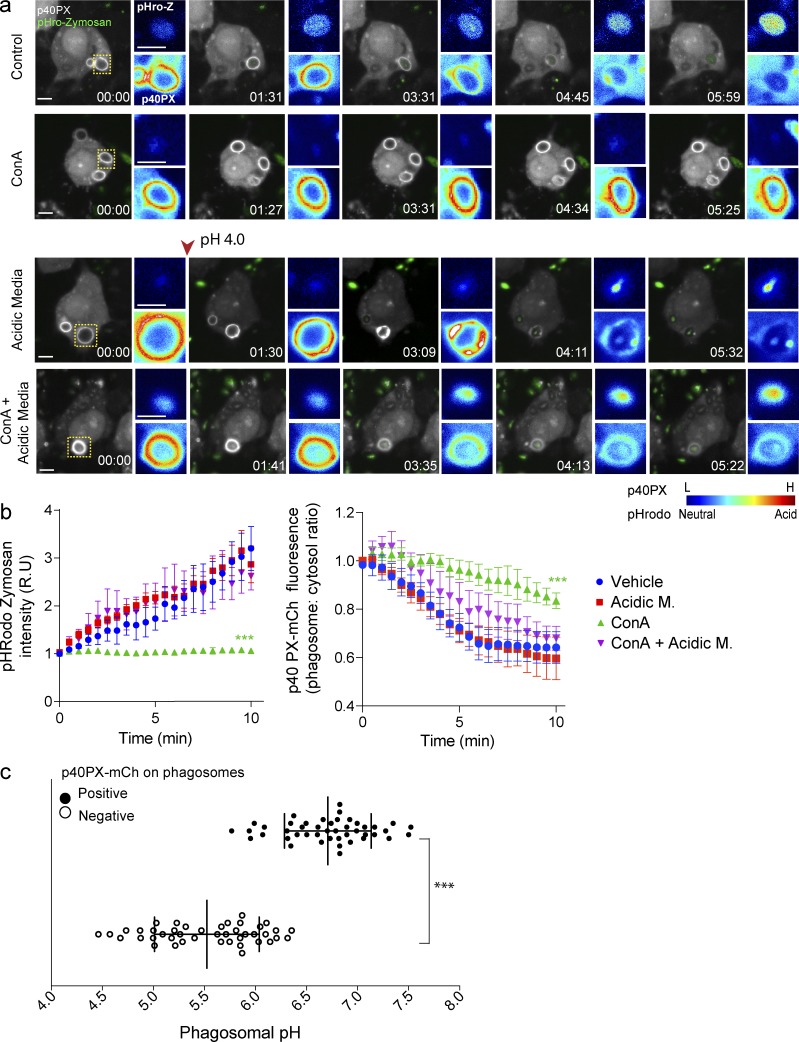
p40PX-mCh recruitment to zymosan-containing phagosomes is pH dependent. (a) Live-cell imaging of p40PX-mCh–expressing (white) RAW cells, internalizing pHrodo-conjugated zymosan particles (green), either in culture media (vehicle) or in acidic media (pH 4.0), with or without 1 µM ConA. The arrowhead indicates the switch to acidic media, 30 s after the onset of the experiment. Images were acquired every 15–30 s. Images to the right of the main panels show fluorescence intensities (rainbow) for pHrodo-zymosan (top) and p40PX-mCh (bottom) phagosomes framed in the main panels. Blue indicates low fluorescence levels for p40PX-mCh and pHrodo (neutral pH), whereas red indicates high-emission signal for p40PX-mCh and pHrodo (acidic pH). (b) Progression of pHRodo and p40PX-mCh fluorescence intensities in zymosan-containing phagosomes for the experimental conditions described in panel a. Each time point was normalized to 0 mins, represented as relative units (R.U). Data shown are normalized means ± SEMs from 3 independent experiments (n = 10–15 phagosomes for each). ANOVA test was used to compare each treatment condition to control; ***, P < 0.001. Bars, 5 µm. (c) RAW cells expressing p40PX-mCh were challenged with pHrodo-conjugated zymosan and pH determined for p40PX-mCh–positive and –negative phagosomes. Data represent 15 phagosomal pH values ±SD from three independent experiments. Each phagosome was internally calibrated (***, P < 0.001).

