Figure 2.
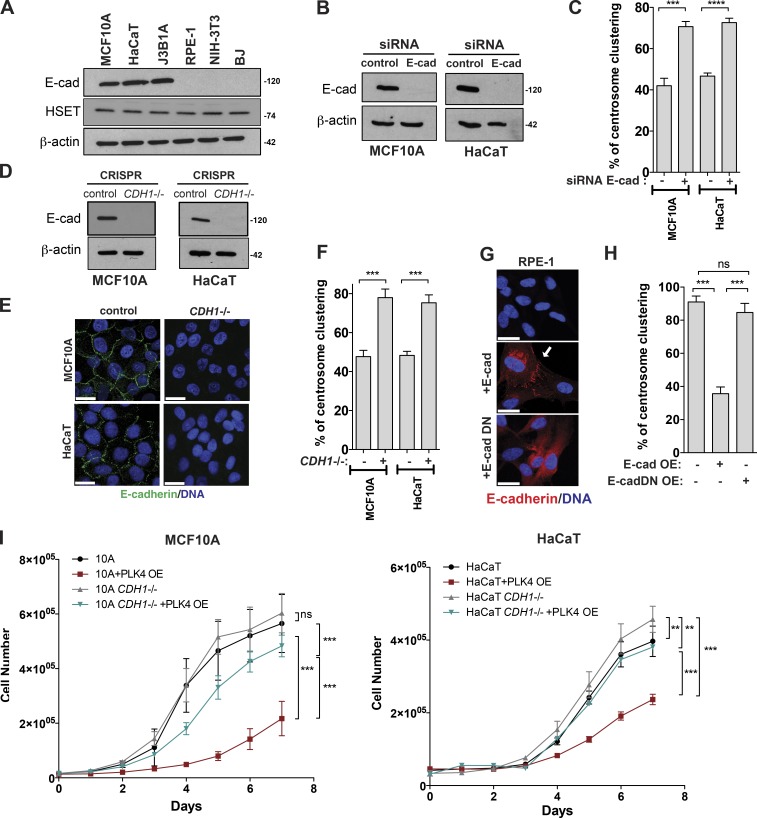
Loss of E-cadherin promotes efficient centrosome clustering in nontransformed cell lines. (A) Western blot analysis of E-cadherin and HSET levels in a panel of nontransformed cell lines. (B) Western blot analysis of E-cadherin levels in MCF10A and HaCaT cells after siRNA depletion of E-cadherin. (C) Quantification of centrosome clustering in cytokinesis upon DCB treatment in E-cadherin depleted cells (n = 150). (D) Western blot analysis of E-cadherin levels in MCF10A and HaCaT cells upon CRISPR-Cas9 knockout of E-cadherin (CDH1−/−; five knockout clones combined for each cell line). (E) Immunofluorescence images of control and CDH1−/− MCF10A and HaCaT cells stained for E-cadherin (green) and DNA (blue). (F) Quantification of centrosome clustering in cytokinesis in control and CDH1−/− cells (n = 150). (G) Immunofluorescence images in RPE-1 cells expressing WT E-cadherin and E-cadherin DN. Cells were stained for E-cadherin (red) and DNA (blue). White arrow highlights the cell–cell junctions. (H) Quantification of centrosome clustering in cytokinesis in RPE-1 cells expressing E-cadherin and E-cadherin DN (n = 150). (I) Analyses of the survival curves in control and CDH1−/− MCF10A and HaCaT cells upon induction of centrosome amplification via PLK4 overexpression (PLK4 OE). For all graphics, error bars represent mean ± SD from three independent experiments. **, P < 0.01; ***, P < 0.001; ****, P < 0.0001; ns, not significant. Bars, 20 µM.

