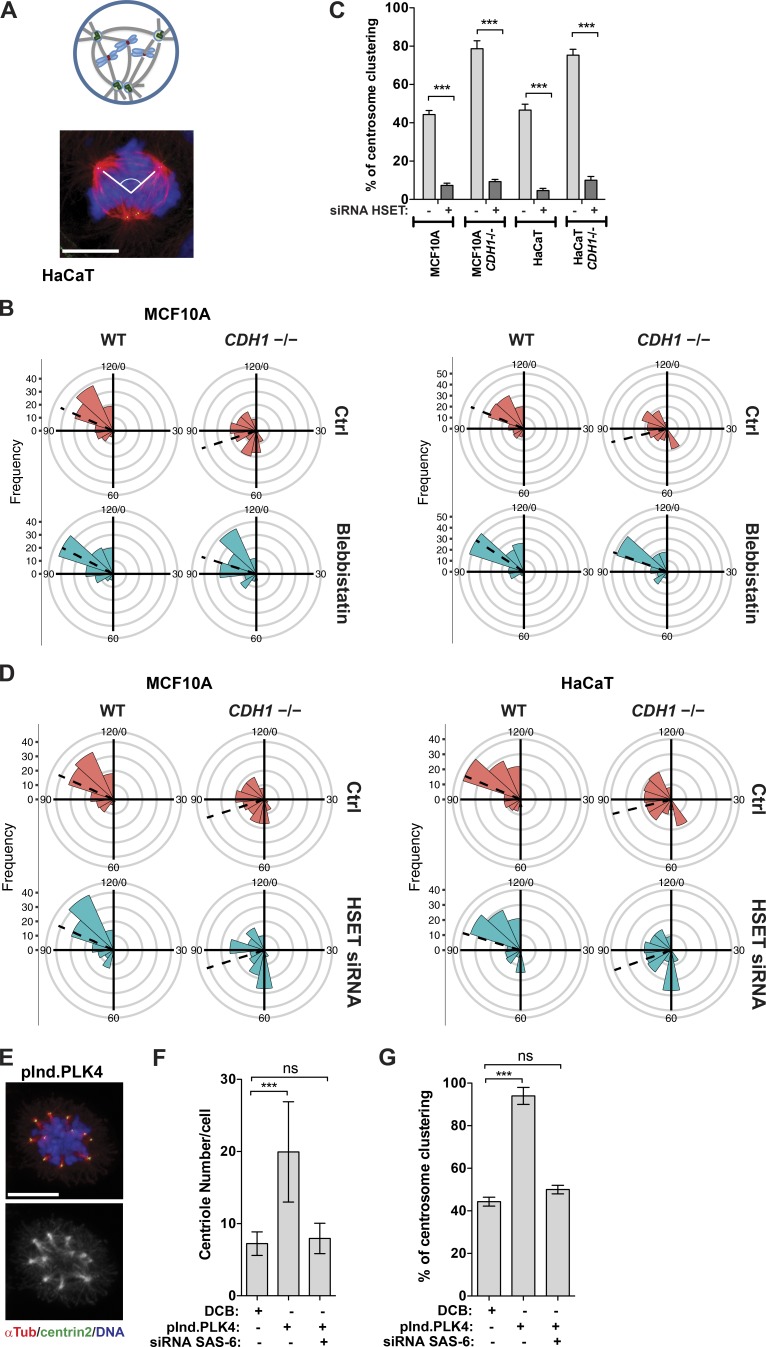
Figure 5.
Inhibition of cortical contractility downstream of E-cadherin/DDR1 complex inhibits centrosome movement. (A) Representation of the angles measured between the two closest poles in tripolar metaphases. Cells were stained for microtubules (α-Tub, red), centrioles (centrin2, green), and DNA (blue). Bar, 10 µm. (B) Rose plot showing the frequency of the angles measured in MCF10A and HaCaT cells (control and CDH1−/−) upon blebbistatin treatment (50 µM, 4 h; n = 150). Dashed line represents the mean angle distribution. (C) Quantification of centrosome clustering in cytokinesis upon depletion of HSET by siRNA (48 h). (D) Rose plot showing the frequency of the angles measured in MCF10A and HaCaT cells (control and CDH1−/−) upon HSET siRNA. Dashed line represents the mean angle distribution. (E) Immunofluorescence images of mitotic cells with high levels of extra centrosomes. Cells were stained for microtubules (α-Tub, red), centrioles (centrin2, green), and DNA (blue). Bar, 10 µm. (F) Quantification of number of centrioles per mitotic cell in cells overexpressing PLK4 treated or not with SAS-6 siRNA for 48 h (n = 150). (G) Quantification centrosome clustering in cells overexpressing PLK4 treated or not with SAS-6 siRNA for 48 h. For all graphics, error bars represent mean ± SD from three independent experiments. ***, P < 0.001; ns, not significant.

