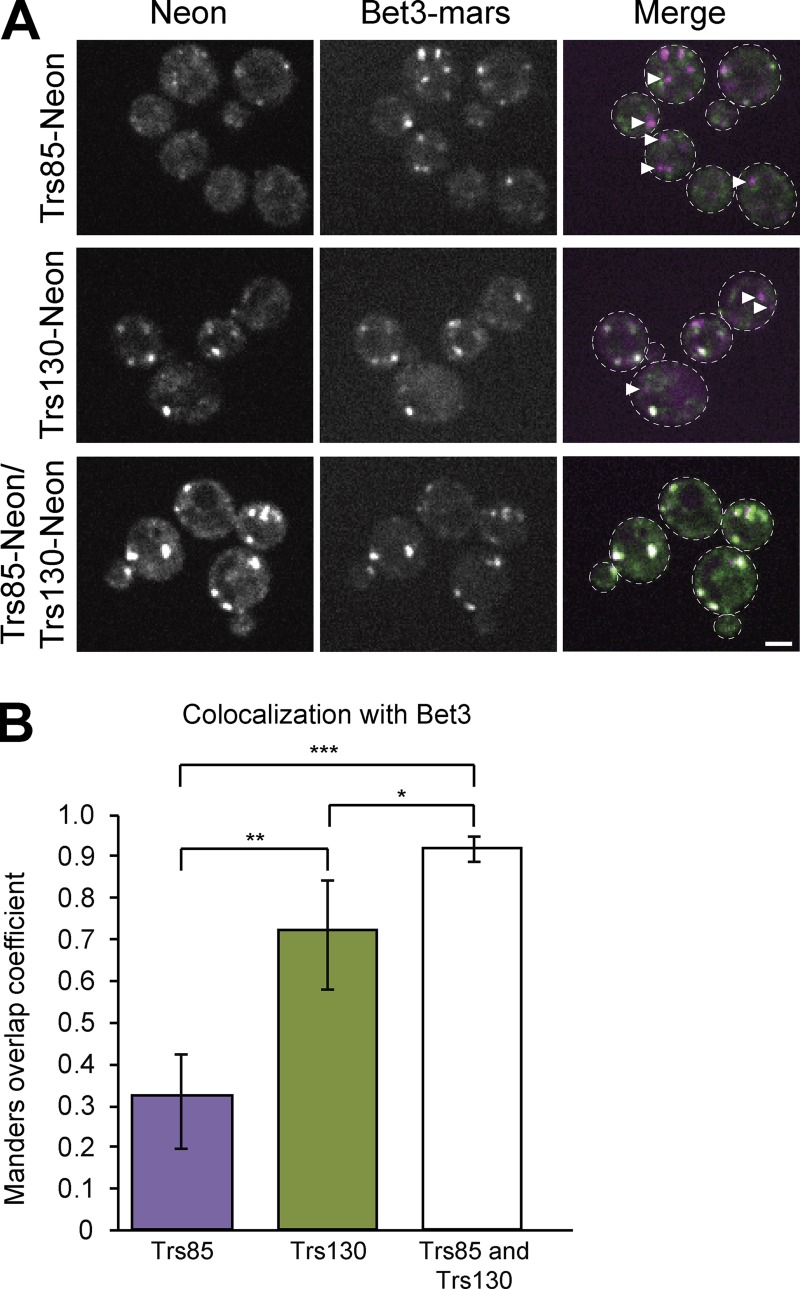
Figure 2.
The TRAPPI core colocalizes completely with TRAPPII- and TRAPPIII-specific subunits. (A) Single focal planes are shown of live-cell fluorescence microscopy images under normal growth conditions. Cells are expressing endogenously tagged Bet3-3×mRFPmars with Trs85-mNeonGreen (top), Trs130-mNeonGreen (middle), or both (bottom). (B) The amount of overlap between Bet3 and Trs85, Trs130, or both was quantified using the Manders overlap coefficient. Images were cropped to contain between four and nine cells, and then five images for each strain were analyzed to create the mean Manders overlap coefficient. Error bars represent 95% CIs. *, P < 0.05; **, P < 0.01; ***, P < 0.001 for unpaired two-tailed t test with Welch’s correction. Arrowheads designate Bet3 puncta that do not overlap with either Trs85 or Trs130. Dashed lines represent cell boundaries. Bar, 2 µm.

