Figure 6.
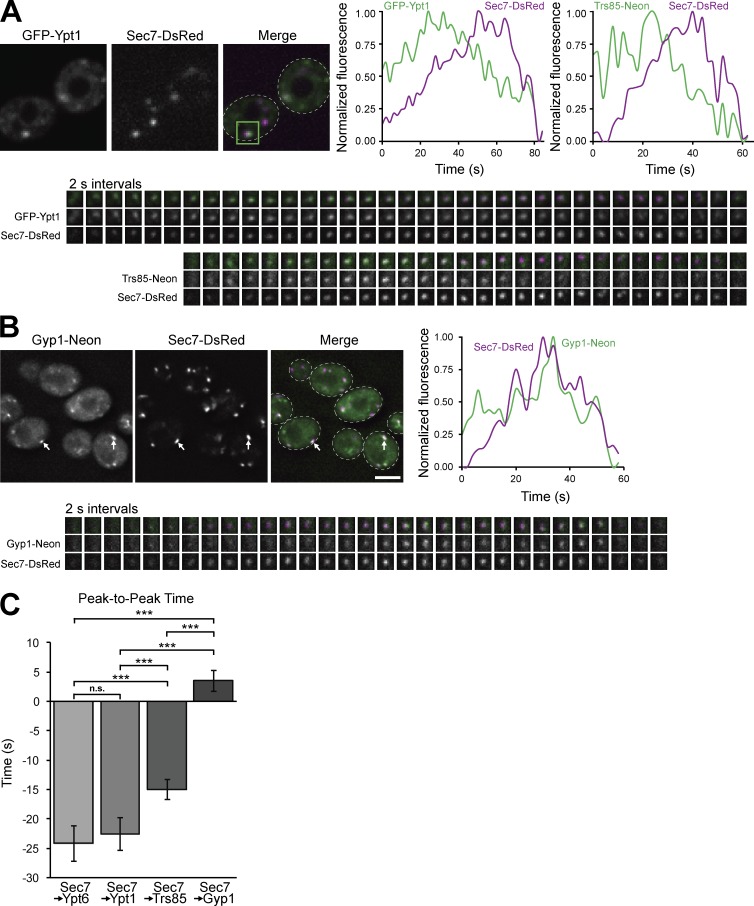
TRAPPIII and the Rab GAP Gyp1 regulate Ypt1 activation at the medial/late Golgi. (A) Time-lapse imaging series (2-s intervals) of single Golgi compartments (green boxed region of the Merge panel) in cells expressing Sec7-6×DsRed with GFP-Ypt1 or Trs85-mNeonGreen. (A, top right) Normalized quantification of fluorescent signal from the boxed regions. (B, top left) Localization of Gyp1-mNeonGreen relative to Sec7-6×DsRed. (B, top right and bottom) Time-lapse imaging series and normalized quantification of Gyp1-mNeonGreen and Sec7-6×DsRed at a single Golgi compartment. (C) Quantification of peak-to-peak times for each indicated protein relative to Sec7-6×DsRed. t = 0 corresponds to peak Sec7 recruitment to the Golgi. Error bars represent 95% CIs. n ≥ 16 series. ***, P < 0.001 for one-way ANOVA with Tukey’s test for multiple comparisons. White arrows denote colocalization of Gyp1 and Sec7 at Golgi compartments. Dashed lines represent cell boundaries. Bars, 2 µm. Regions of interest for time-lapse imaging are 0.7 × 0.7 µm.

