Fig. 4.

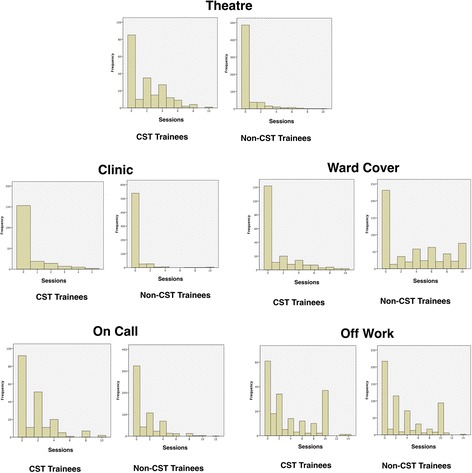
Histograms illustrating frequency of number of sessions undertaken by Core surgical trainees versus non-Core surgical trainees in Theatre, Clinic, Ward Cover, On Call, and Off Work

Histograms illustrating frequency of number of sessions undertaken by Core surgical trainees versus non-Core surgical trainees in Theatre, Clinic, Ward Cover, On Call, and Off Work