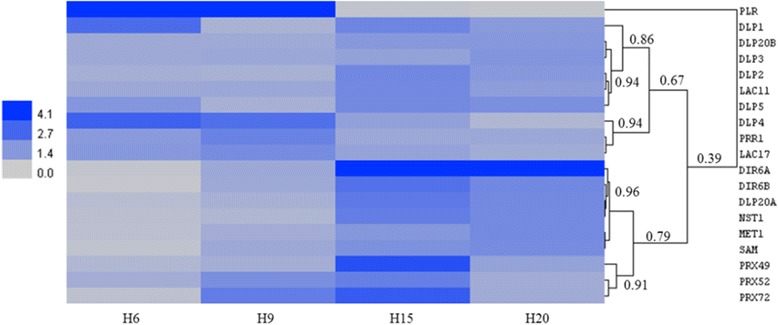
Fig. 4.

Heatmap hierarchical clustering showing the expression of genes assessed by RT-qPCR. Values represent Calibrated Normalized Relative Quantities (CNRQ) calculated with qbase+. DLP dirigent-like protein, LAC laccase, PRR1 pinoresinol reductase 1, DIR dirigent protein, NST1 NAC secondary cell wall thickening 1, MET1 methionine synthase 1, SAM S-adenosylmethionine synthase, PRX peroxidase, PLR pinoresinol-lariciresinol reductase. The colour bar indicates the expression values represented as an increasing intensity gradient. The numbers refer to the Pearson correlation coefficients between the lengths of two branches. The CNRQ data are given in Additional file 2
