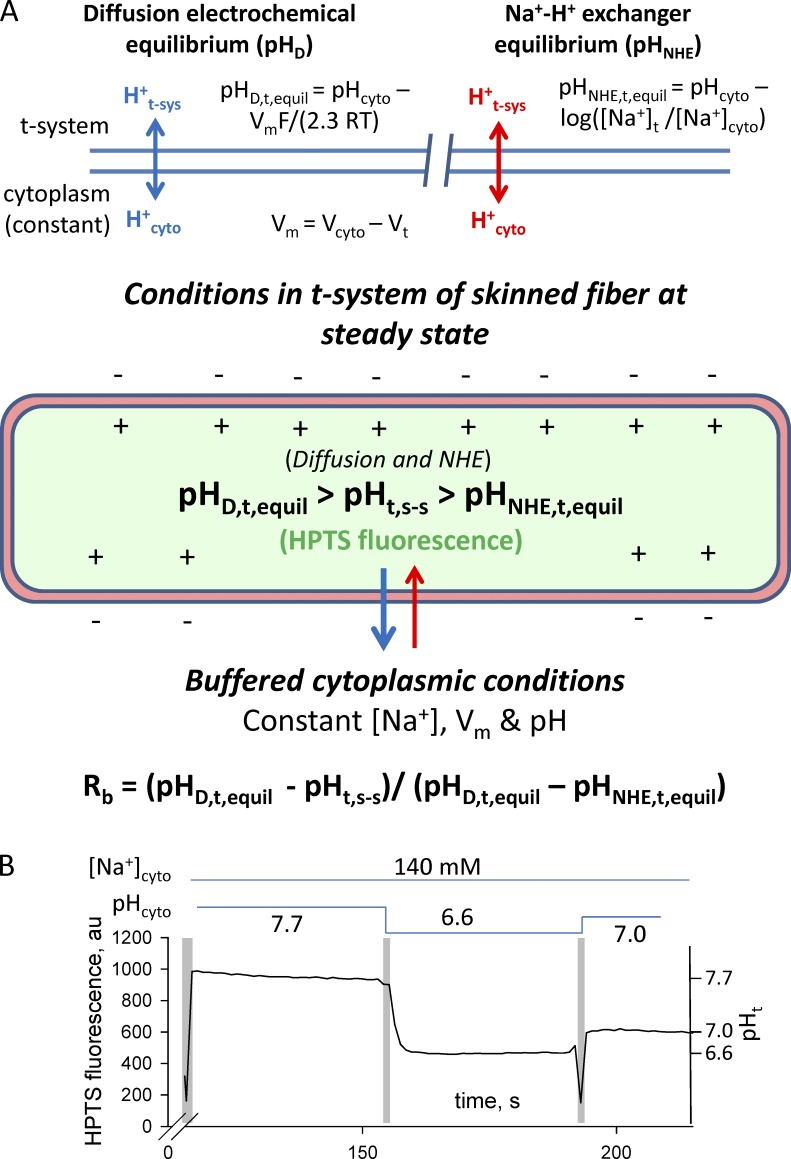
Figure 4.
Fluxes that determine sealed t-system pH at steady state (pHt,s-s) and pH calibration of the HPTS signal. (A and B) Diagram of proton fluxes across the t-system membrane in skinned muscle fibers (A) and calibration of HPTS signal inside the sealed t-system using monensin (B). The schematic diagram indicates the expected movements of protons across a membrane caused by diffusion (top, left) and caused by the action of NHE (top, right). The diagram of the sealed t-system labeled in green shows that the HPTS trapped in the sealed t-system will report the pH in the t-system at steady state when there is no net flux of protons across the t-system caused by diffusion and NHE activity. The fluorescence traces in B show a typical pH calibration of HPTS fluorescence inside the sealed t-system. Solution exchanges are indicated by the vertical pale gray bars, and the composition of the cytosolic solution is indicated by the horizontal lines above the trace. Note that monensin was applied in the first indicated solution. The HPTS fluorescence signal has been used to calculate the FMax, pK, and background of 889, 7.31, and 315 arbitrary units (au), respectively. The calibrated t-system pH (pHt) is indicated on the right y axis. pHD,t,equil, pH in the t-system at electrochemical equilibrium; pHNHE,t,equil, pH in the t-system at NHE equilibrium; pHt,s-s, pH in the t-system at steady state.

