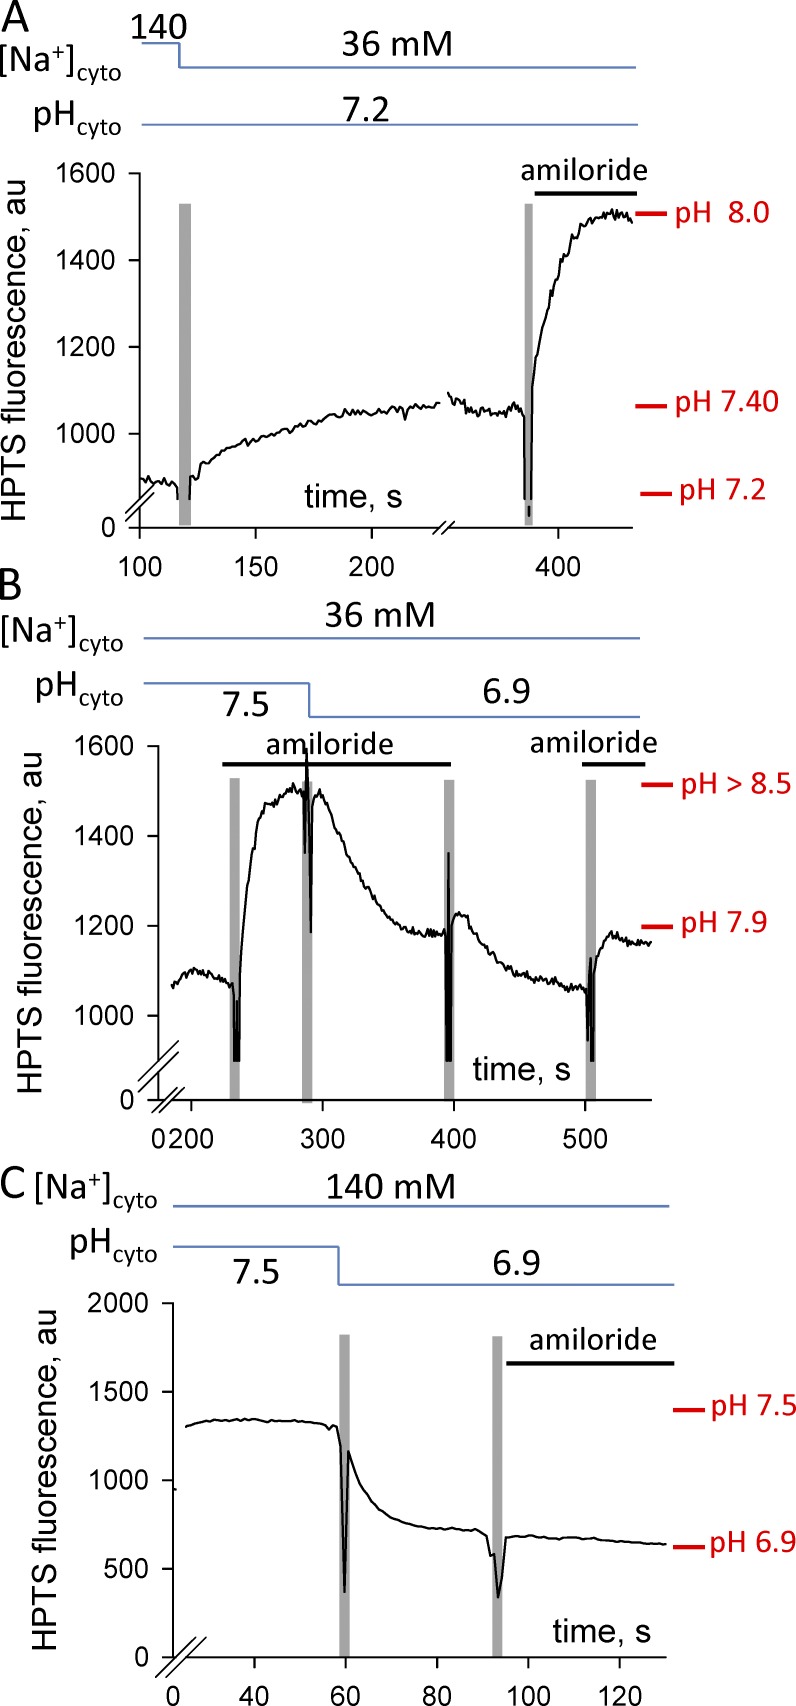
Figure 6.
Amiloride effects on the pHt. Traces of t-system trapped HPTS fluorescence signal. (A) Changes in the pHt after replacement of Na-based solution of pH 7.2 with K-based solution of pH 7.2 and after the introduction of 50 µM amiloride. (B) The effect of amiloride on the pHt in K-based solutions is reversible. (C) The HPTS fluorescence signal does not change after the introduction of amiloride to the Na-based solution in which the preparation was equilibrated. Solution exchanges are indicated by the vertical pale bars, and the composition of the internal solution is indicated by the horizontal lines above each trace. The presence of amiloride in solutions is indicated as a solid bar just above the trace.

