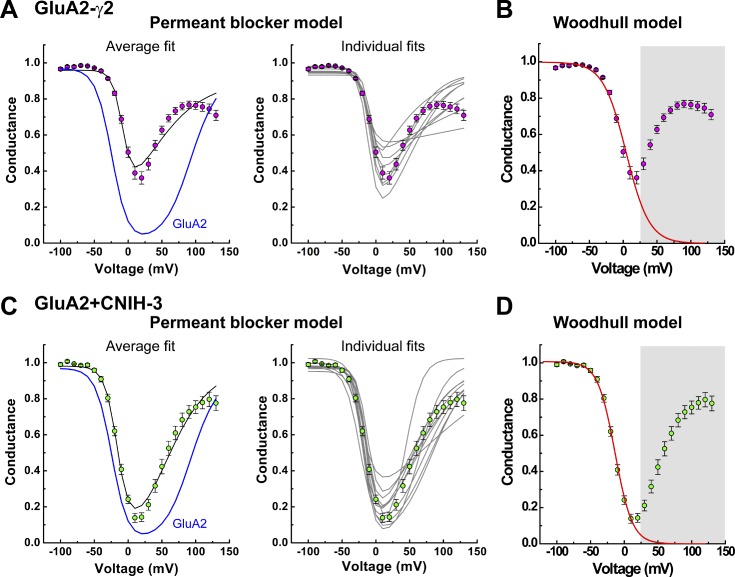
Figure 4.
G–V plots with auxiliary proteins are poorly fit by the permeant blocker model. (A and C) Mean (left) and individual (right) fits of the corrected G–V plots with the permeant blocker model (Eq. 3a) for GluA2-γ2 (A) and GluA2 + CNIH-3 (C). The continuous black lines indicate fits of the data; the continuous blue lines illustrate the fit of the GluA2 data for comparison. (B and D) Mean fits using the Woodhull model (Eq. 3b) for an impermeant blocker for GluA2-γ2 (B) and GluA2 + CNIH-3 (D). Continuous red lines indicate fits of the data (fit range, −100 to 20 mV). Data points between 30 and 130 mV were masked. Data are shown as means ± SEM.

