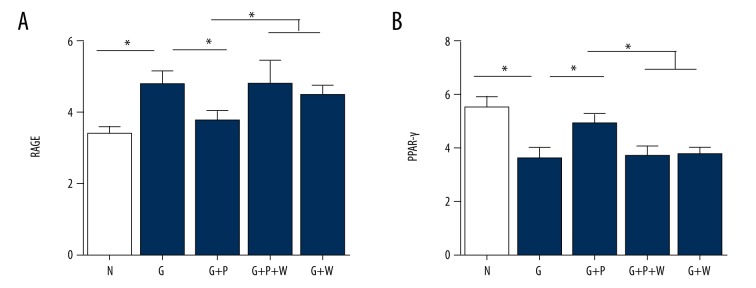
Figure 5.
Effects of pioglitazone treatment on RAGE and PPAR-γ mRNA expression in cultured primary mouse VSMCs. (A) Real-time PCR analysis showing mRNA expression of RAGE in VSMCs. (B) Real-time PCR analysis showing mRNA expression of PPRA-γ in VSMCs. N – normal glucose; G – high glucose; P – pioglitazone; W – GW9662. * p<0.05. N=8 per group.

