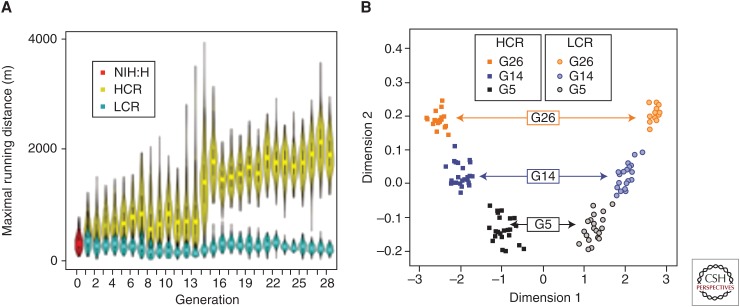
Figure 1.
Running and genetic distance changes as a function of divergent selection. (A) Response to selection for 28 generations. Each symbol represents the distribution of running distance for each generation in each line. The symbols for each generation combine box plots and kernel density plots to depict the observed probability density. Males and females combined (n = 11,442 rats). NIH:H are the genetically heterogeneous founder stock rats. (B) Estimate of genetic “distance” between low-capacity runner (LCR) and high-capacity runner (HCR) lines. Multidimensional scaling showed that genetic distance between the lines increased across generations 5, 14, and 26. Dimension 1 = LCR-HCR lines, and dimension 2 = generation. Dimension estimates for 142 rats shown. (A, From Ren et al. 2013; reprinted, with permission, from the authors.)

