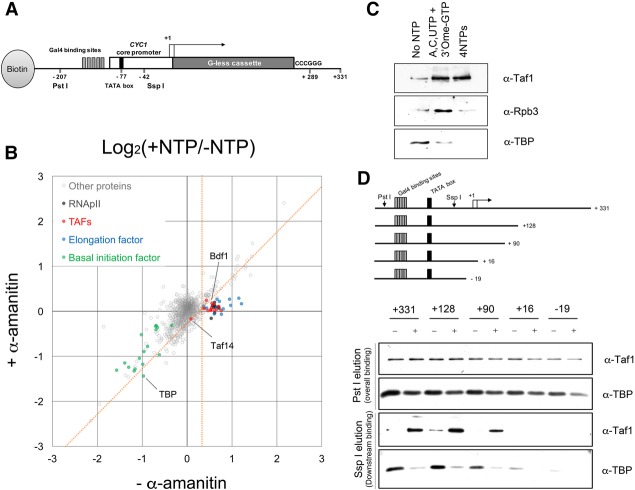
Figure 1.
Transcription-mediated TAF association with downstream DNA. (A) Schematic of the transcription template used to isolate RNAPII ECs as described in the Materials and Methods. Downstream bound proteins are eluted using Ssp I endonuclease, which cuts 35 nucleotides downstream from the TATA box but upstream of the first TSS. Total proteins are eluted with Pst I (see Supplemental Fig. S1D). (B) Scatter plot comparing NTP-dependent protein binding to downstream DNA (log2 of +NTP/−NTP ratio) in the presence (Y-axis) or absence (X-axis) of α-amanitin. Each circle represents one protein (1511 total), with the value calculated from the sum of all peptide signals identified for that protein. Proteins in specific subgroups are color-coded as noted. Proteins specifically dependent on transcription are defined as those at the right of the vertical orange line (95% confidence level for enrichment with NTPs) on the X-axis and below the diagonal orange line (95% confidence level cutoff for reduction of NTP enrichment by α-amanitin) (see also Supplemental Fig. S1A–C; Supplemental Table S1). (C) Immunoblot of proteins eluted from immobilized templates with Ssp I before treatment with NTPs or after 15 min of incubation with A, C, and UTP plus 3′O-meGTP (to stall ECs) or all four NTPs to allow RNAPII runoff (see also Supplemental Fig. S2B). (D) TBP and Taf1 binding on immobilized templates of different lengths. The top panel shows a schematic of the template series analyzed as in B. The middle panels show immunoblots of total bound proteins eluted with Pst I, while the bottom panels show downstream binding proteins eluted with Ssp I (see also Supplemental Fig. S2A,C).

