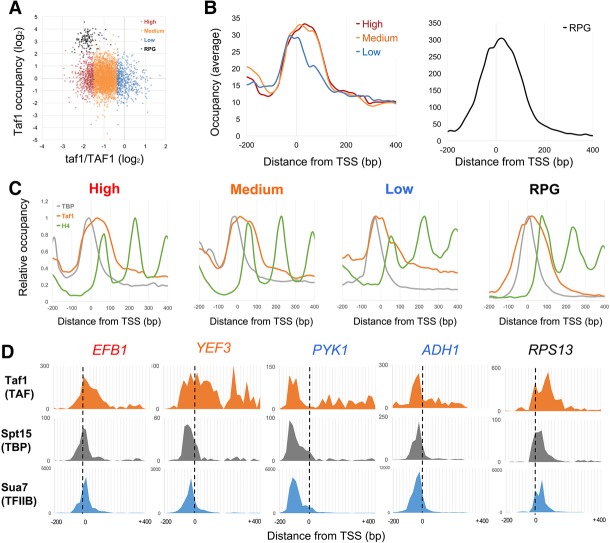
Figure 2.
Taf1 downstream binding correlates with its transcription function. (A) Scatter plot of Taf1 transcription dependence versus total occupancy. For 4348 scored mRNA genes, the taf1/TAF1 mRNA expression level ratios from Huisinga and Pugh (2004) were plotted in log2 scale on the X-axis. For each promoter, total Taf1 occupancy was plotted by summing ChIP-exo counts from −100 bp to +300 bp relative to the TSS (Rhee and Pugh 2012), dividing by the average for all mRNA gene promoters, and plotting in log2 scale on the Y-axis. Excluding the 137 RPGs, high TAF dependence genes (825) were defined as those with taf1/TAF1 expression ratios below −1 SD (SD = 0.57) from the mean of all gene ratios (−0.95). Medium dependence genes (4327) had ratios between −1 and +1 SD, and low dependence genes (729) had more than +1 SD from the mean of ratios. Average ratios in high, medium, low, and RPG groups were −1.73, −0.92, −0.08, and −1.82, respectively (see also Supplemental Fig. S3A). (B) Averaged Taf1 occupancy for the four groups was plotted relative to the TSS (high [red], medium [orange], low [blue], and RPG [black]) using ChIP-exo data from Rhee and Pugh (2012) (see also Supplemental Fig S3B,C). (C) Occupancies for TBP, Taf1, and nucleosomes were plotted for the four groups separately to compare peak positions. (Gray) TBP; (orange) Taf1; (green) histone H4. For each curve, data were normalized by setting the maximum value to 1.0. (D) Individual gene examples of Taf1 (TAF), Spt15 (TBP), and Sua7 (TFIIB) profiles at EFB1 (high TAF1 dependence, −2.02), YEF3 (medium TAF1 dependence, −1.21), PYK1 (low TAF1 dependence, 0.02), ADH1 (low TAF1 dependence, 0.35), and RPS13 (RPG; TAF1 dependence, −1.00).

