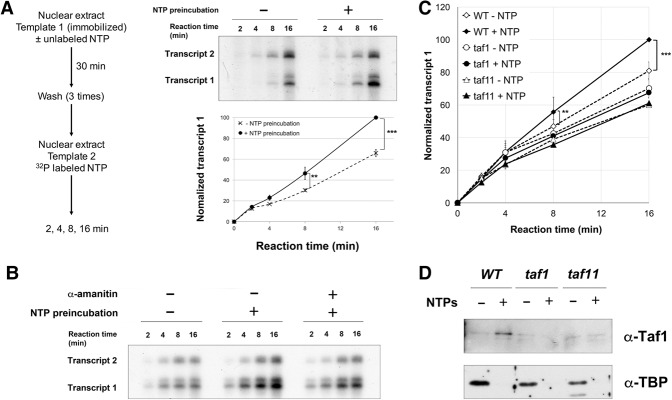
Figure 5.
Taf1 promotes transcription reinitiation. (A) A schematic of two-step sequential reactions used to analyze transcription reinitiation is at the left. Note that no transcription activator was used in these experiments. Yeast nuclear extract was preincubated with immobilized template 1 (as in Fig. 1A) in the presence or absence of NTPs (400 µM each). After three washes, nuclear extract, 32P-labeled NTPs, and the longer G-less cassette template 2 (pG5CG-D2/F916) were added. (Top right panel) After 2, 4, 8, and 16 min, labeled transcripts were isolated and analyzed by gel electrophoresis and autoradiography. (Bottom right panel) Quantitation from three independent reactions plots transcript 1 levels over time, normalized by setting the 16-min maximum to 100 and using transcript 2 to correct for variations in recovery or reaction conditions. Error bars indicate SD (see also Supplemental Fig. S6A). (**) P = 0.01; (***) P = 7.5 × 10⁻⁵. (B) The sequential transcription assay was performed with NTPs and 10 µg/mL α-amanitin in the preincubation, as indicated. (C) Sequential transcription assay comparing wild-type (YSW87) with mutant taf1 (YSW90) or taf11 (YSB1732) nuclear extracts in the first preincubation reaction. After washes, the second transcription reaction was performed with wild-type nuclear extract prepared from strain BJ2168. Quantitation from three (taf11) or five (taf1) independent replicates is shown. (**) P = 0.08; (***) P = 5.2 × 10⁻⁵. All other differences were not statistically significant (see also Supplemental Fig. S6C). (D) Immobilized template reactions as in Figure 1 were performed with elution by SspI digestion and immunoblotting for Taf1 and TBP, comparing wild-type (YSW87) with mutant taf1 (YSW90) or taf11 (YSB1732) nuclear extracts. Note that Taf1 levels were roughly similar in all three extracts, as can be seen from the basal signal in the −NTP lanes.

