Figure 2.

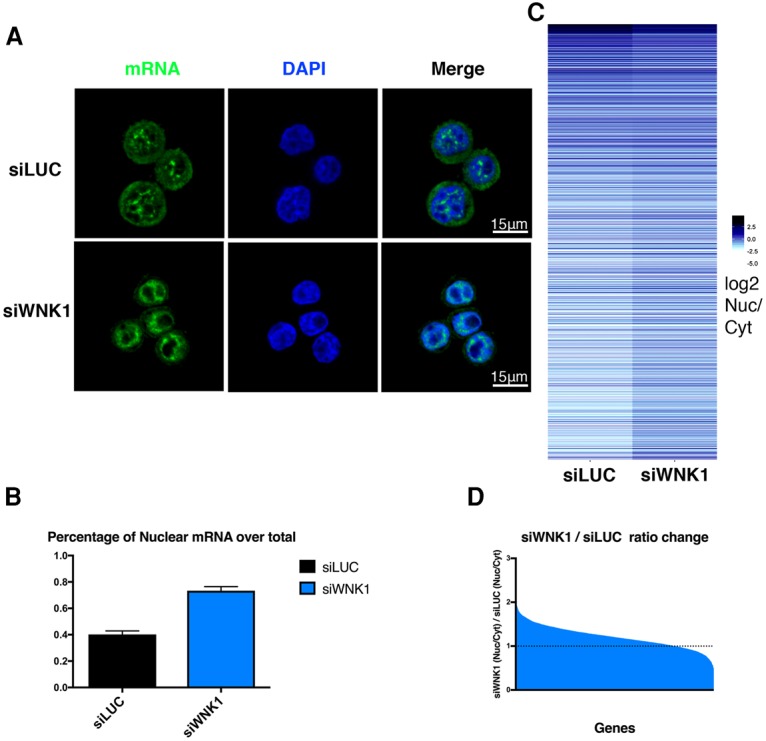
WNK1 participates in mRNA export. (A) Fluorescent oligo-dT FISH for the detection of mRNA levels in control and WNK1-depleted cells. Alexa fluor 488-dT(23) was used as a probe, and DAPI was used for DNA staining. (B) Quantitation of the percentage of nuclear-localized mRNA over total. The integrated intensity of the nuclear fluorescent signal and the total fluorescent signal were calculated for every cell (n = 30; data are from two biological repeats), and the ratio between the two is presented graphically. Error bars represent SEM. (C) Heat map representing the log2 ratio of nuclear over cytoplasmic (Nuc/Cyt) mRNA in control and WNK1-depleted cells for the top 20% of expressed genes. The darker shade indicates an increased Nuc/Cyt ratio. (D) Quantification of the fold change of Nuc/Cyt mRNA levels between siLUC and siWNK1 cells in the top 20% of expressed genes. Most genes in this set show an increase of Nuc/Cyt ratio upon WNK1 depletion.
