
Figure 3.
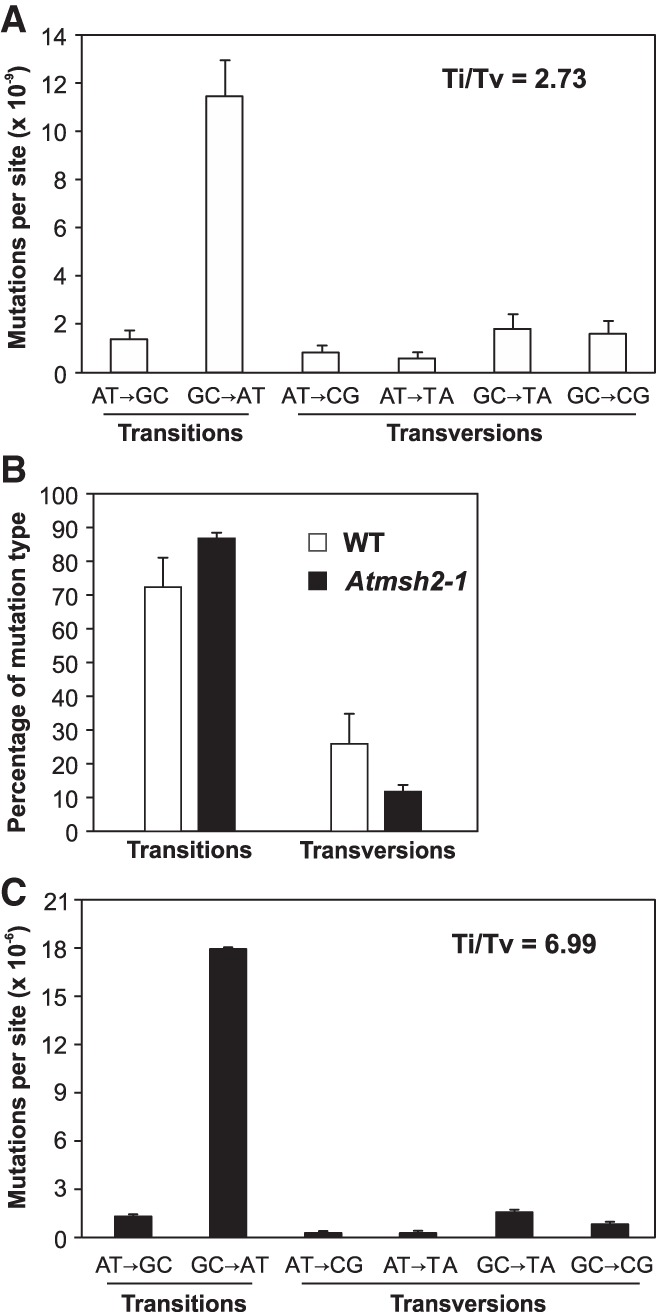
Comparisons of SNV mutational spectra in WT and MMR-deficient A. thaliana. (A) Mutation spectrum and Ti/Tv ratio in MMR-proficient WT MA lines (data from Ossowski et al. 2010). (B) Relative percentage of transitions versus transversions in G5 Atmsh2-1 MA line plants versus that seen in MMR-proficient WT MA lines (WT data from Ossowski et al. 2010). (C) Mutation spectrum and Ti/Tv ratio of SNVs detected in MMR-deficient G5 Atmsh2-1 MA line plants. Error bars (A–C) indicate SEM from five (WT data) or eight (MMR-deficient data) biological replicates (in some cases, too small to be clearly visible).