
Figure 5.
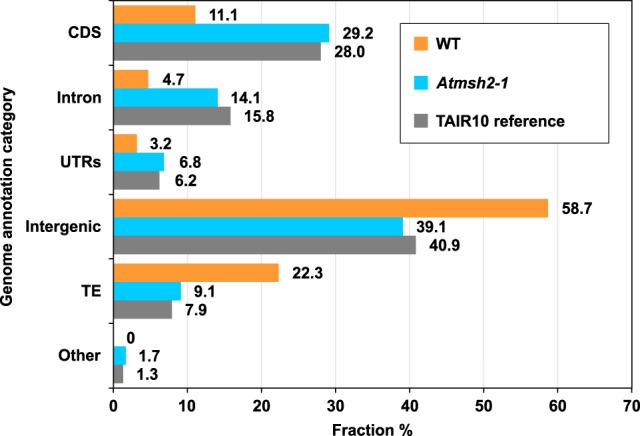
Genome-wide distribution of SNV mutations in WT and Atmsh2-1 A. thaliana MA lines. Gray bars show the relative distribution of A. thaliana reference genome annotation categories (expressed as a percentage of the total genome): (CDS) coding DNA sequence; (UTRs) untranslated regions; (TE) transposable element; (Other) noncoding RNAs and pseudogenes. Orange bars show relative distribution (%) of SNVs in WT MA lines between different genomic annotation categories; data from Ossowski et al. (2010) and Jiang et al. (2014) were averaged for each genomic annotation category. Blue bars show relative distribution (%) of SNVs in MMR-deficient Atmsh2-1 MA lines between different genomic annotation categories. Number (N) of WT SNVs from Ossowski et al. (2010), N = 98; from Jiang et al. (2014), N = 44. Number of Atmsh2-1 SNVs, N = 4048.