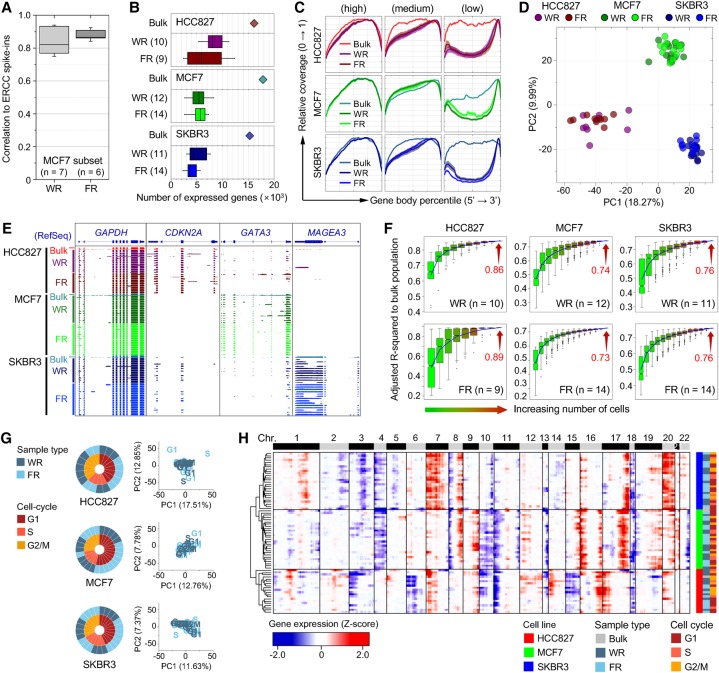
Figure 4.
Evaluation of single-cell RNA-seq performance using SIDR-seq. (A) Correlations of ERCC spike-in standards between RNA input abundance and read density output for WR and FR. The box plot shows the distribution of the correlation coefficients for the detected synthetic RNAs. (B) Number of genes detected in single-cell WRs and FRs. For HCC827, MCF7, and SKBR3 cell lines, bulk data are displayed on top of corresponding cell lines as a reference. The number of samples is indicated in parentheses. (C) Sequence coverage along the normalized transcript length. For the analysis, transcripts were selected based on their expression level. Transcripts were rank-ordered by expression level and classified into three categories in each sample: top 1000 transcripts (left), middle 1000 transcripts (middle), and bottom 1000 transcripts (right). Coverage ratio was normalized to the maximal degree of coverage in each sample. (D) Principal component analysis (PCA) of HCC827, MCF7, and SKBR3 single-cell transcriptomes. Genes used in PCA are identified in Supplemental Figure S11A. RNA-seq data of both WRs and FRs single cells from each cell line clustered together. (E) Genomic snapshots of cDNA read alignments in the GAPDH, CDKN2A, GATA3, and MAGEA3 genes. (F) Adjusted R2 of gene expression in various numbers of single cells relative to the bulk cells was determined by multiple regression analysis with randomly selected cell numbers (with permutation ×1000). For the box plots in B and F, the box indicates interquartile range (IQR) between the first and the third quartiles, and the error bar shows 10–90th percentiles. (G) PCA of single cells subgrouped based on the cell-cycle stages. Gene sets used in PCA were identified in Supplemental Figure S13A. The cell-cycle stage of each single cell was determined by the expression of 874 cell-cycle marker genes (Whitfield et al. 2002), as shown in Supplemental Figure S12D. The overall fractions of cell-cycle phases of WRs and FRs were displayed on the left side. (H) Unsupervised hierarchical clustering heatmap of chromosomal gene expression patterns. The dendrogram was generated based on the Euclidean distance metric with Ward's method (Ward 1963). (FR) RNA fractionated by SIDR from single cells; (WR) total RNA from whole-cell lysates of single cells.

