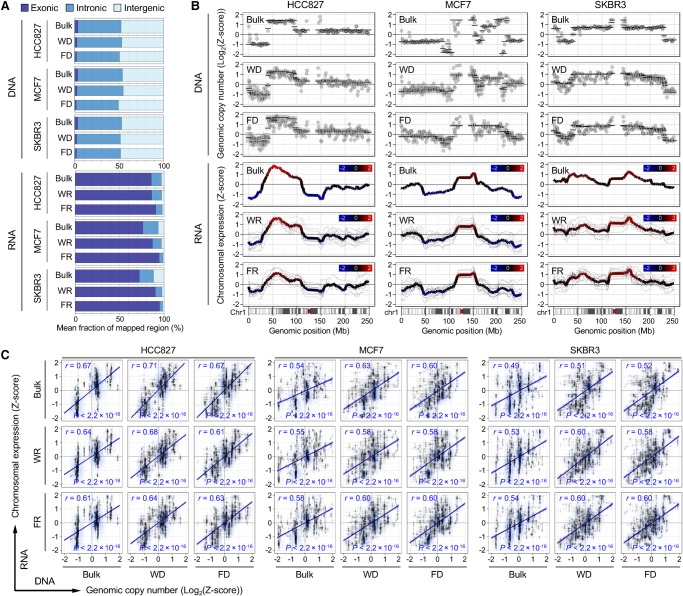
Figure 5.
Integration of genome and transcriptome sequencing data generated by SIDR-seq. (A) Fractions of sequencing reads mapped to exonic, intronic, and intergenic regions of the human reference genome. Mean fractions of mapped regions were calculated from WGS and RNA-seq. (B) Chromosome-wide comparison between genomic copy numbers and gene expression in Chromosome 1. The upper three plots show log2 ratio of genomic copy numbers (dots) and their CBS-derived segmented values (black lines) estimated from bulk and single cells for DNA sequencing. The lower three plots show the chromosomal gene expression values from each single cell (thinner gray line) and their averages (colored line). Chromosomal gene expression correlated with copy-number events in WRs and FRs. Comparison plots for other chromosomes (from Chr 2 to Chr 22) are available in Supplemental Figure S15. (C) Correlation between DNA copy numbers and relative gene expression levels binned per 1 Mb genomic scale. Pearson's correlation coefficients (r) with their statistical significances (P) are shown. Genome sequencing from bulk, WDs, and FDs, and RNA sequencing data from bulk, WRs, and FRs were used for the comparison. (FD) DNA fractionated from single cells by SIDR; (WD) genomic DNA from the whole-cell lysates of single cells; (FR) RNA fractionated by SIDR from single cells; (WR) total RNA from whole-cell lysates of single cells.

