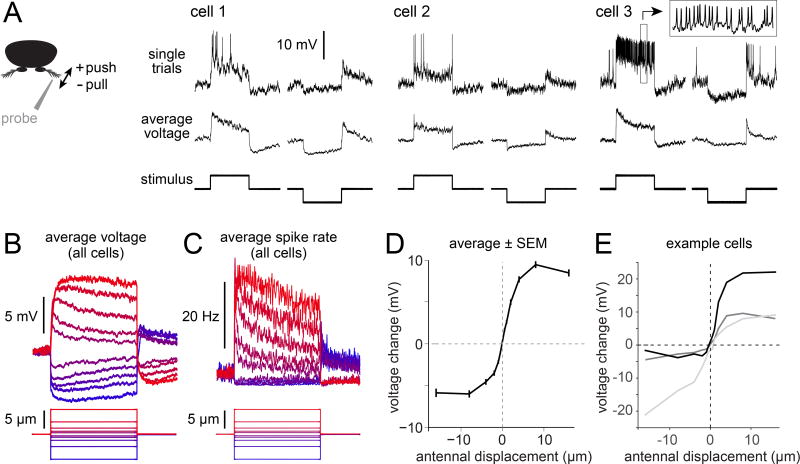
Figure 2. aPN3 neurons bidirectionally encode antennal position.
A) Responses to static displacements for three example aPN3 neurons (positive = push, negative = pull). Top: single traces. Note spikes, about 10 mV in amplitude. Inset shows a snippet of spiking activity (boxed region) with the time scale expanded 15-fold. Bottom: average voltage (i.e., the trial-averaged voltage after clipping spikes). Stimuli are displacements of 2 µm, 5 sec in duration.
B) Average voltage responses to a family of displacements for the aPN3 population (±0.5, 1, 2, 4, and 8 µm, 5 sec in duration). Data are averaged across all recorded aPN3 neurons that were tested with these stimuli (n=20 cells in 14 flies).
C) Same as (B) but for spike rates. With small displacements, adaptation is visible in both the average voltage and the spike rate. With large displacements, adaptation is visible in the spike rate but not the average voltage; this may be due in part to the fact that spiking prevents the membrane potential from maintaining a sustained depolarization above the spike threshold.
D) Displacement-response curve for the aPN3 population (n=20 cells in 14 flies). The response is quantified over a window 2 – 5 sec after step onset.
E) Same as (D) but for three example cells. The slope of this function is a measure of a cell’s sensitivity to movement. Some cells are most sensitive to positive movements, whereas others are most sensitive to negative movements.

