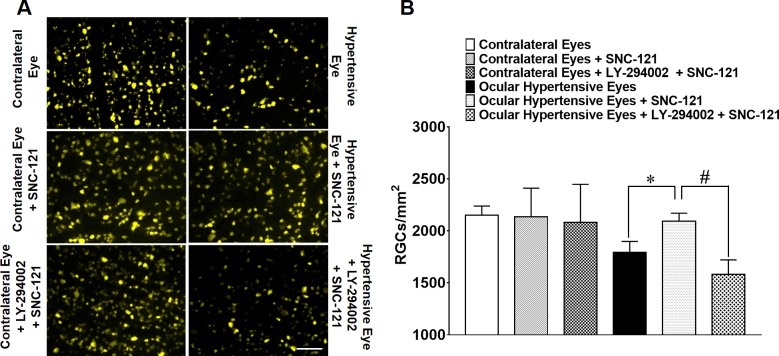
Figure 9.
(A) Fluorescence micrographs of flat-mounted retinas depicting Fluorogold-labeled RGCs in normal, ocular-hypertensive, SNC-121–treated, and LY-294002 + SNC-121–treated eyes. Briefly, 3 μL of a 5% solution of Fluorogold was injected into the superior colliculus of anesthetized animals. Seven days post Fluorogold injection, animals were euthanized, and retinas were prepared as flat-mounts, vitreous-side facing up. Fluorescent RGCs were visualized under Zeiss microscopy. Scale bar: 20 μm. (B) Rats were divided into three groups: ocular hypertensive (n = 8), SNC-121–treated ocular hypertensive (n = 8), and LY-294002 + SNC-121–treated ocular hypertensive (n = 8). In each retina, eight microscopic fields of identical size (150-μm2 area) were used to count RGCs by ImageJ software. *P < 0.05; n = 8 for each group.

